200 MA & 50 MA
It's Saturday, no action in the market. I've analyzed how to enter a trade, at least option trade as well as how to exit it. I think it's pretty simple in this way, but are there other ways to track or try to predict what an asset might do? Yes, there are several tools and indicators. I've gone over the moving average at the beginning of this journey, but recently I've been hearing a lot of noise about the 200MA and 50 MA. Now, this doesn't mean I have to rely on it just from pressure of hearing it from other people, but rather, I want to learn it – even if I don't use it later on all the time.
Moving average is the sum of closing price of an asset divided by the number of days given, in this case 200 & 50. When the price of an asset is above the 200MA it indicates a bullish trend, when the price is below, then it is considered bearish. What about the 50 MA? Many investors or traders tend to use these two indicators to determine where the asset is headed and to make decisions on their current holdings or potential holdings. Let's look an current $XLE for 200 MA & 50 MA
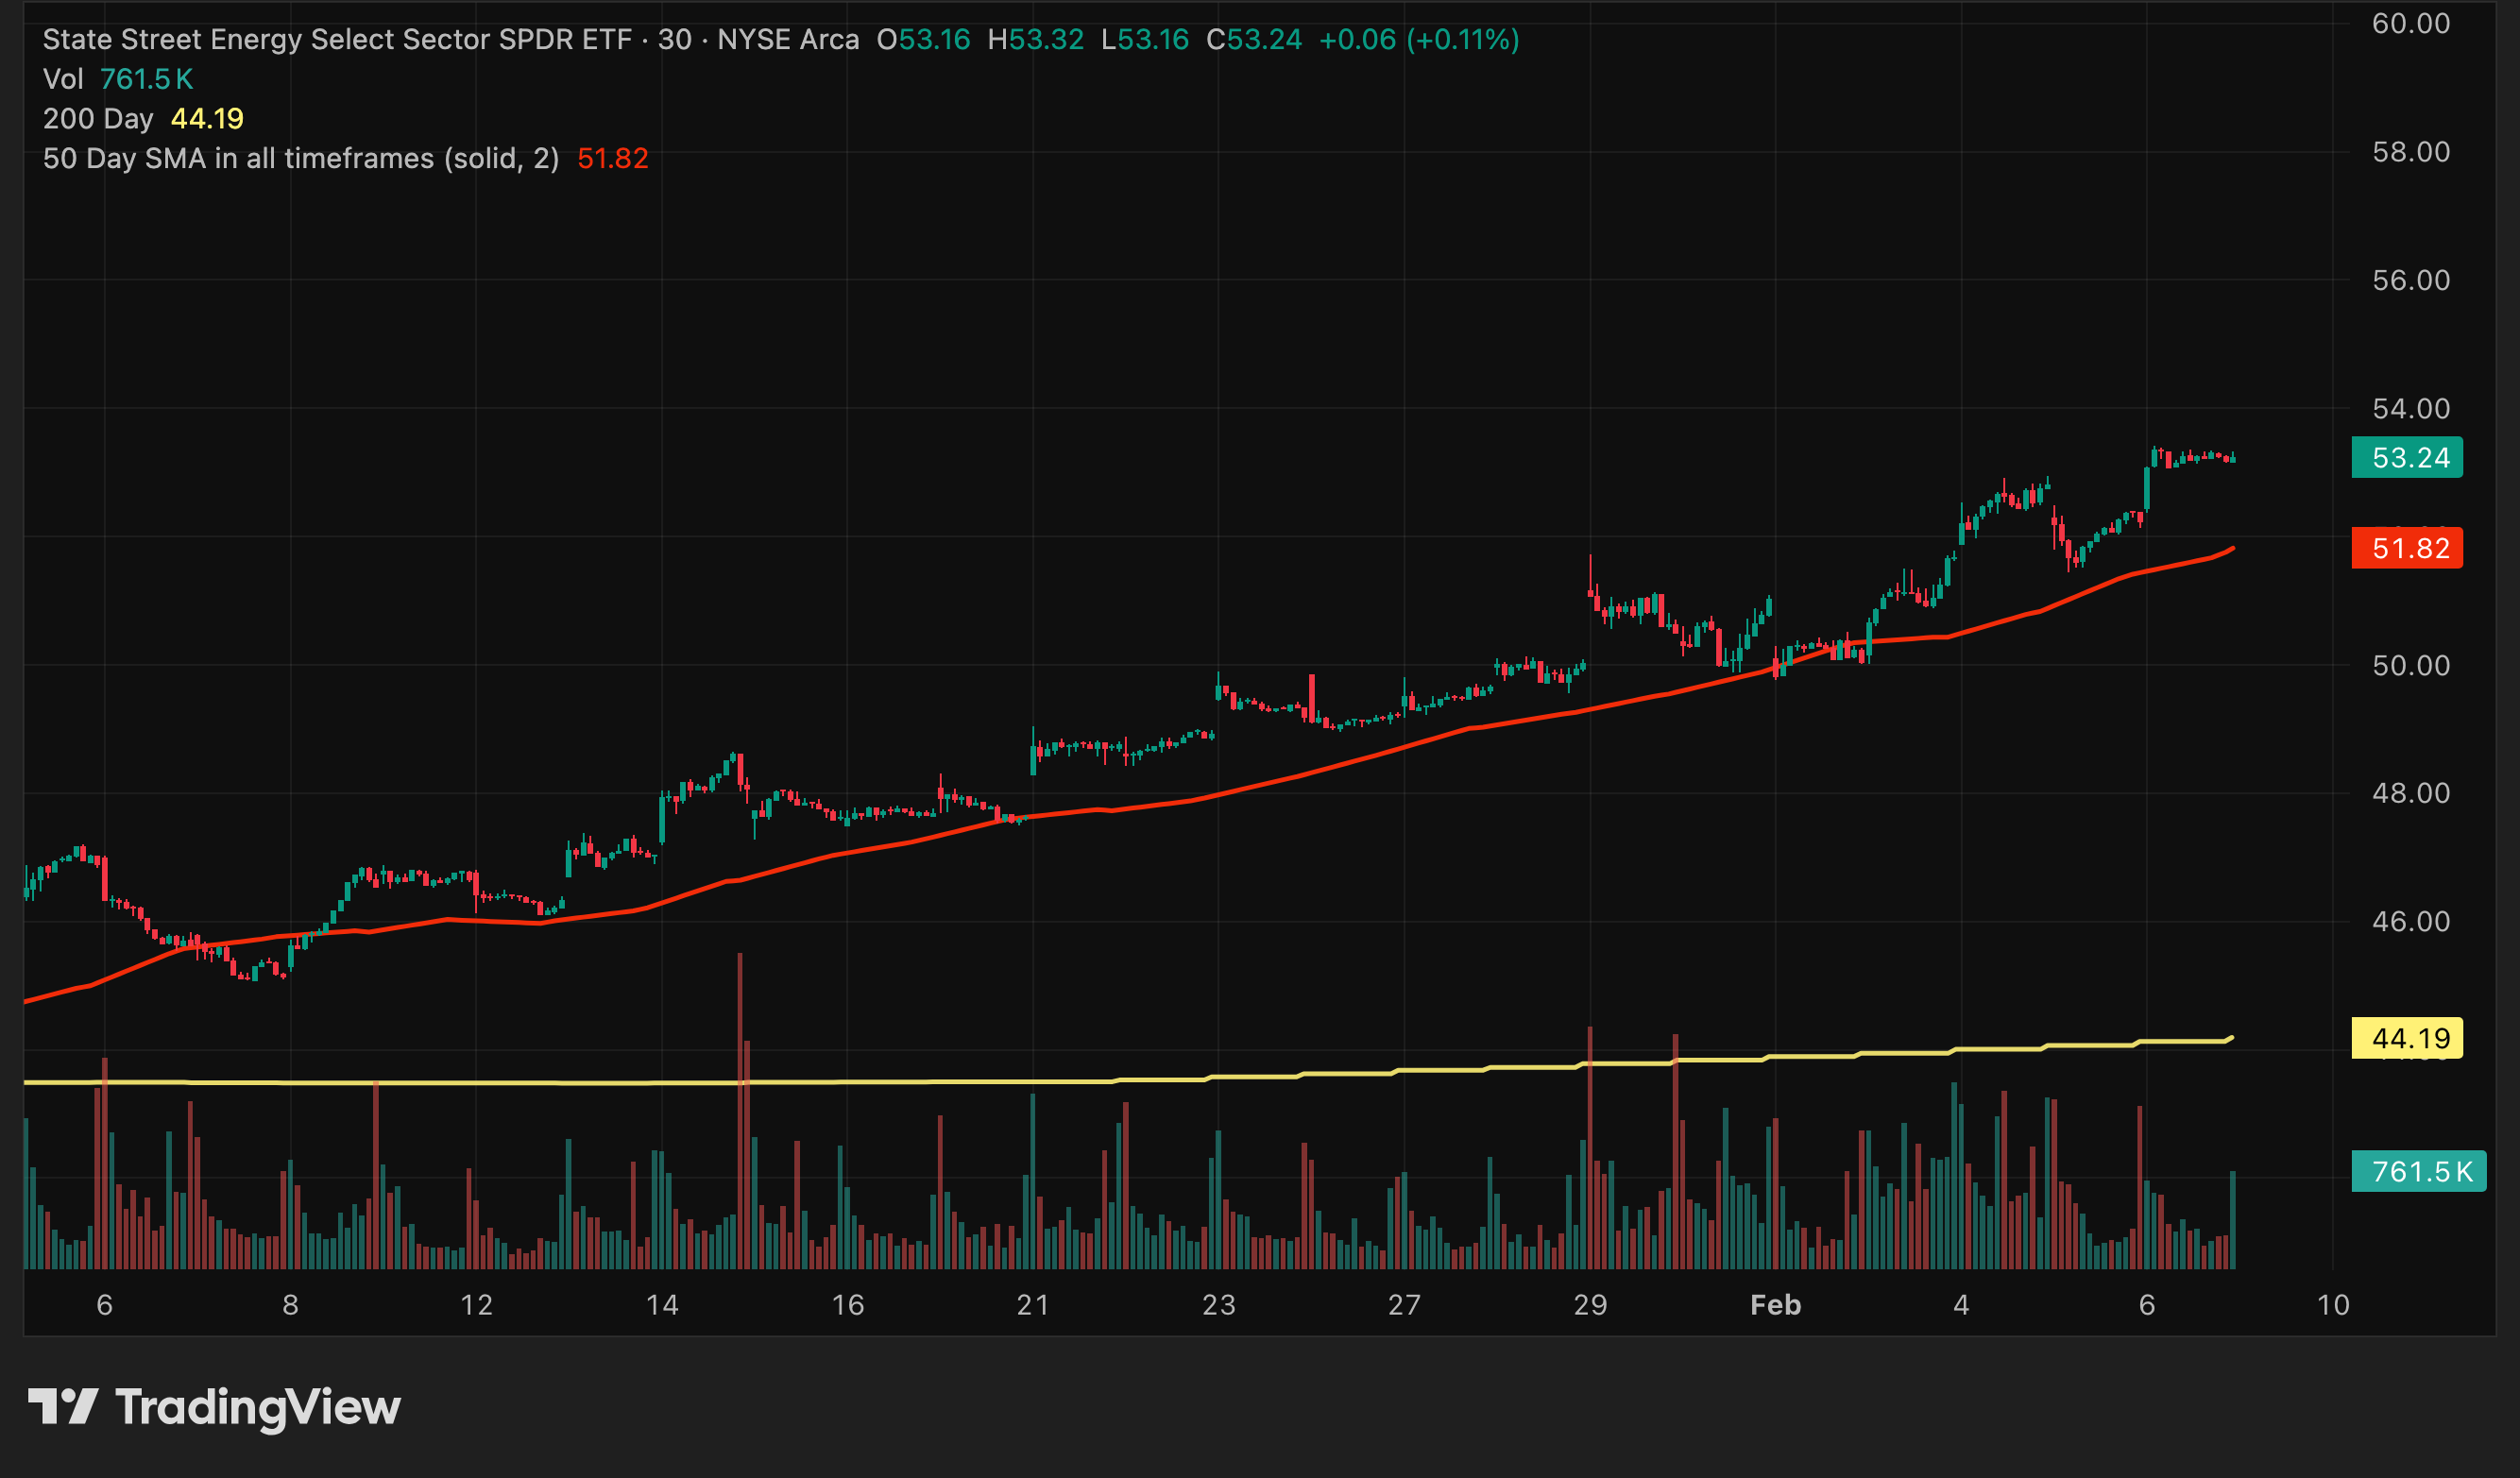
In the chart above, I've brought in both MAs, where the yellow trend line is the 200 MA and the red one is representative of 50 MA. In the above, the 50MA sits well above the 200MA confirming the bullish momentum. Although I mentioned this when I first spoke about MAs ages ago, we need to remember that these are lagging indicators and change daily. So the two MAs are not bound to stay in their current position forever, they could begin to change.
What happens when the 50 MA begins to go under the 200MA? This would be indicative of bearish and downtrend. When this cross is observed, it is referred to it as "death cross". See below for reference of what this looks like:

As you will see, before the death cross happens, we observe a decline begin to happen – this is something we can keep in mind – the opposite occurs when there is a bullish beginning to take place, this is known as golden cross. See below:

This is just another tool we can potentially use during the weekdays when in a contract, in combination with RSI and volume, I think it could help us identify shifts before they are drastic, for both good and bad.
I'll be looking at what I've discussed here all of next week, see the value of it and how we can potentially use it longterm.
Member discussion