Breakout Strategy - Intro
The high level definition is entering when a stock moves beyond a resistance or support with increased volume; when this occurs, it indicates the start of a potential trend.
There are several concepts that are new to me with this strategy so I will break it into different parts. First, I'm understanding that extreme price changes are more typically observed in channel breakouts, and other patterns that we will discuss in other posts (triangle, flags, head and shoulders). Now, what is a channel? a channel is simply put the in-between a defined support and resistance over a period of time. See below for a visual definition of it:
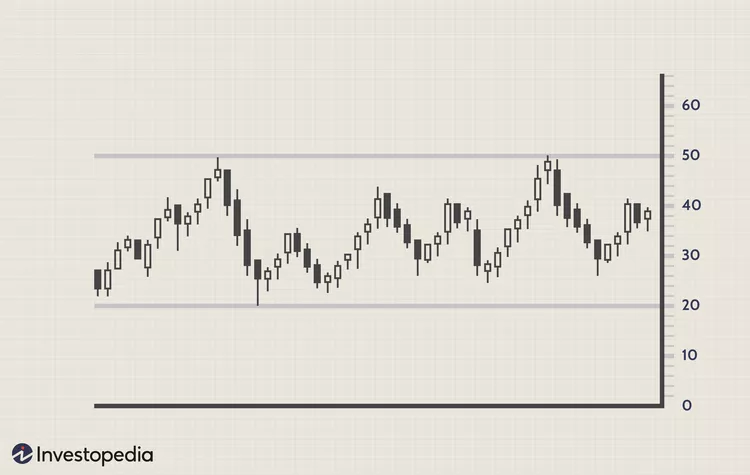
Why is a channel important and what should I look for? A channel is important because it tells us the highs and lows of a stock, when the consistent oscillation is evident in a chart, then we can consider it a valid channel. It is recommended that you look for four points in a channel, two for the lower bound and two for the upper end of it.
As traders, we can use a channel as a prediction model for highs and lows. For example, if the fluctuation has been constant and the channel is defined, then a trader can buy a stock at the support level and have an estimate of the peak price over a period of time. Honestly, this sounds good for options and swing trading in my opinion.
So, when the price of a stocks crosses either end of the channel, we can consider that a breakout. At this point, the channel is no longer as relevant as new bounds may be created over time, therefore defining a new channel.
Now, at the beginning I mentioned that volume plays a role in breakout trading. Volume refers to the number of shares of a stock traded over a specific time frame. What does trading volume tells us? It tells us the confidence behind a move in a trend. So there is above average trading volume and below average. An above average trading volume suggests that there is good conviction of a price among traders, while a low trading volume tells us the opposite. When a breakout takes place, the volume can tell us whether we can expect more out of a stock or not. See the example below from Schwab's site:
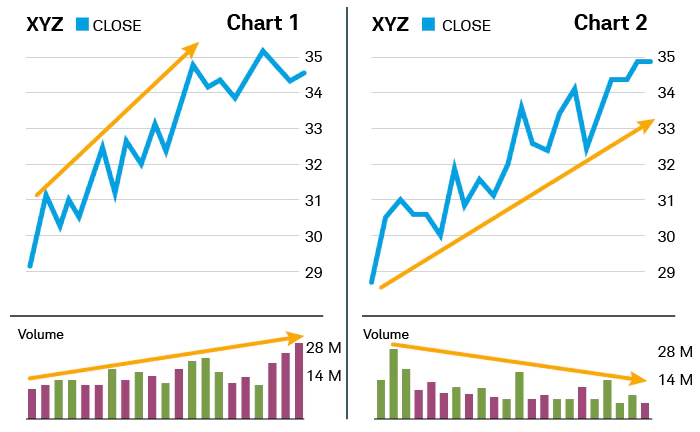
In the above, chart 1 is increasing in both, price and volume indicating heavy conviction in this price action. Those two points suggest that the price might continue to trend higher. On the other hand, we have chart 2 where the price is increasing but the volume is decaying over time. This tells us that there is not much strength behind the stock's price, so it may indicate that the price will decrease.
So now we have explored what a breakout is, what a channel is, and what trading volume is. We have defined the basic concepts and will continue to dive deeper into them in the next few days as well as utilize them in our $NKE for now and later on in other stocks.
There is one thing I want to clarify, in the last two posts I mentioned that I didn't expect the support level I observed for $NKE ~$64 to go lower than that. While that may hold, as I'm learning everyday, I would like to clear that out a bit. Today I learned about breakouts, so a breakout during support is not unrealistic, it's a matter of observing, monitoring, and analyzing a stock's price during a day.
I find that I will probably continue to correct myself in newer posts, but it's fine, this is what it is about, me learning everyday.
Today's post was fun to me. I'm loving how much knowledge I've acquired and how much more I need to understand and learn. Knowledge is power when utilized correctly, and is what I intend to do when I begin to intentionally trade, and that is around the corner for me, as we are on January 17, 2026. In the coming days we'll explore volume trends, triangles, flags, and head and shoulders. Each one of them may be isolated in different posts, but I'll do that because I want to make sure I fully grasp the concepts.
Member discussion