Channel, Volume, & Breakout Into Practice
In the last blog we covered the introduction of what breakout is in the stock market. I also went over some of the fundamental terms that need to be applied to understand a breakout. As mentioned, the breakout strategy is going to be split into different sections so that I can grasp it fully. So, with that said, today I will look at $NKE's chart for the last 5 days, 1 month, and 3 months. This will allow me to understand if there is a defined channel with prominent support and resistance, as well as observing breakouts and fake-outs. In the last post, I highlighted the importance of volume, so we will cover the conviction of current price through the volume observed over the time frames mentioned above.
One Month
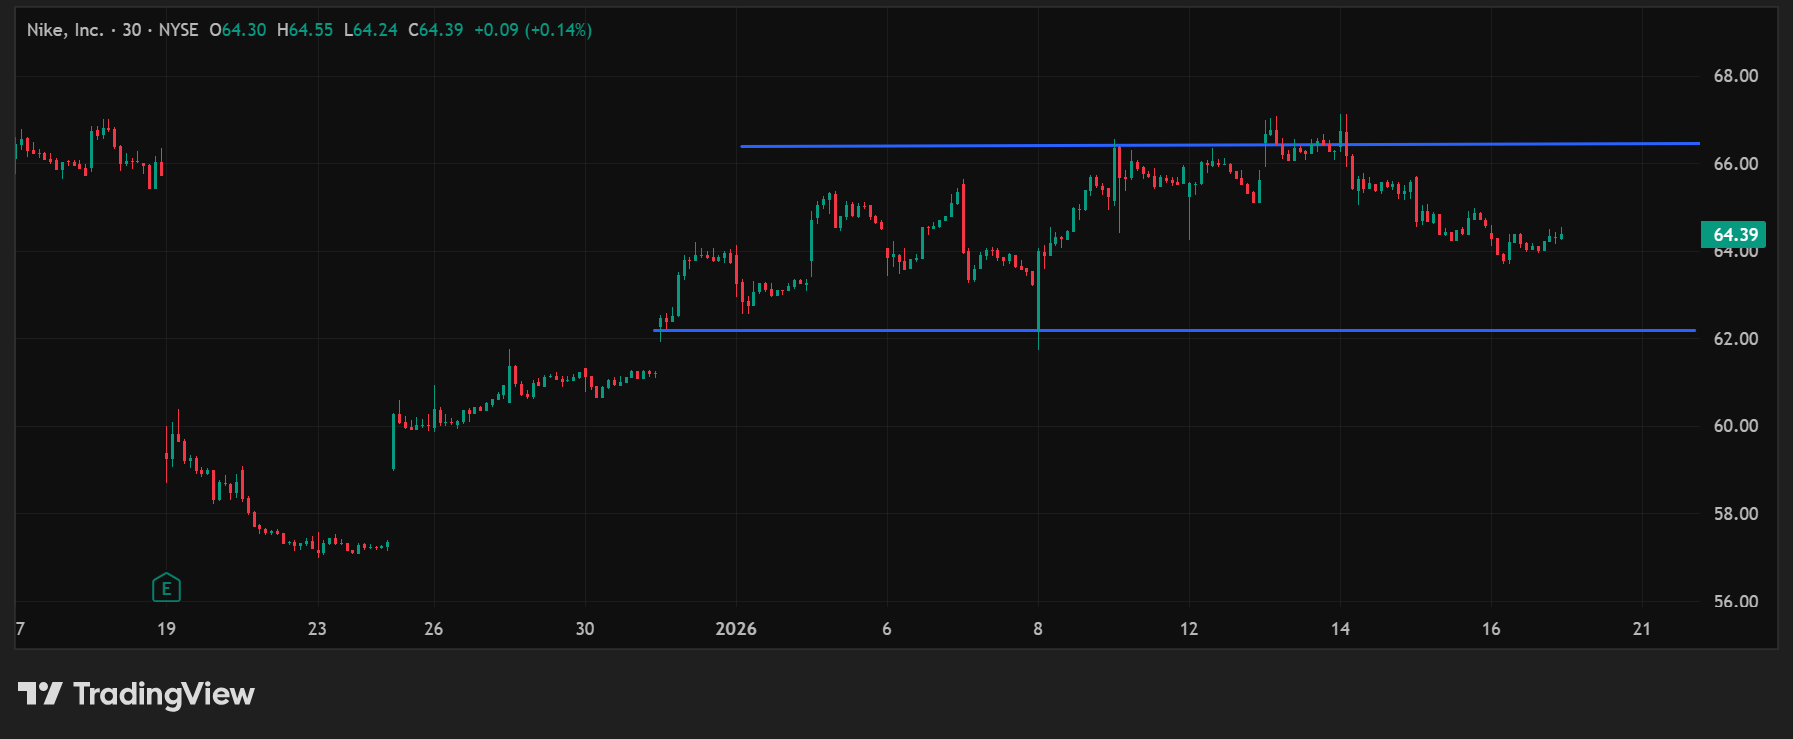
If you recall, we established that in to consider it a valid channel, the upper and lower end of said channel needs to have 4 points, two in the upper band and two in the support area. In the snapshot below for the 1 month timeframe, we can see that the support has been ~$62 and the resistance ~$66. You may notice I focused on the latest days as prior to then, December 17 – December 30, the price between high and low is extreme and a channel is not clearly defined.
Three Months
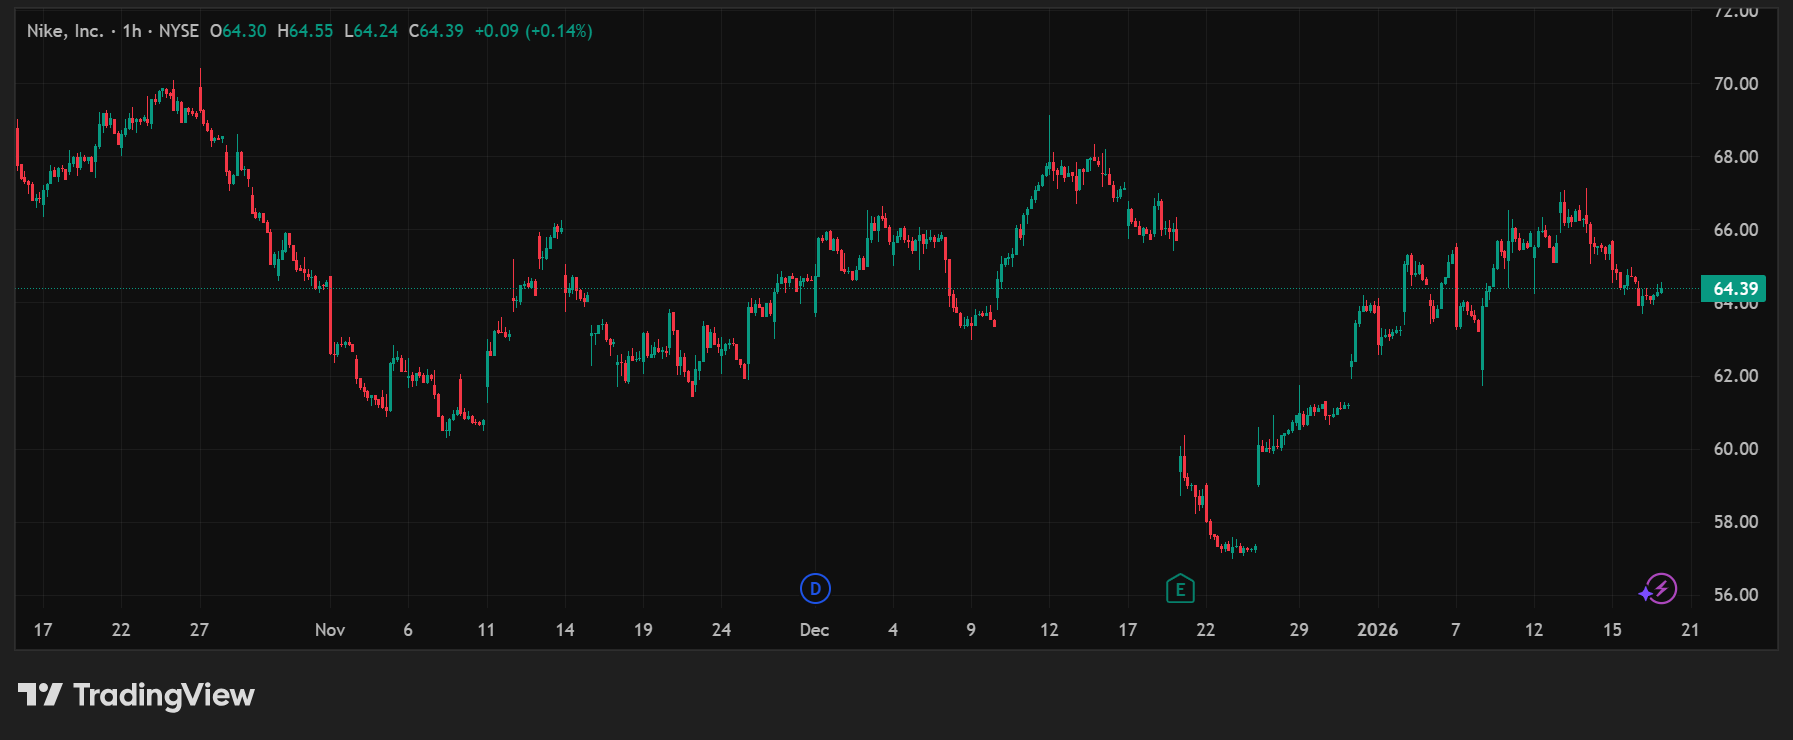
So, the three month's support is a bit more challenging for me to define, while the resistance is more obvious. I could go to the ~$61 – $62 range for the support, and ~$66 for resistance. While the resistance remains the same as the 1 month, the support is slightly lower if you look with close precision. I chose not to stick to $62 for support as we can see a breakout occur in more than one occasion if I stuck to $62 as the support.
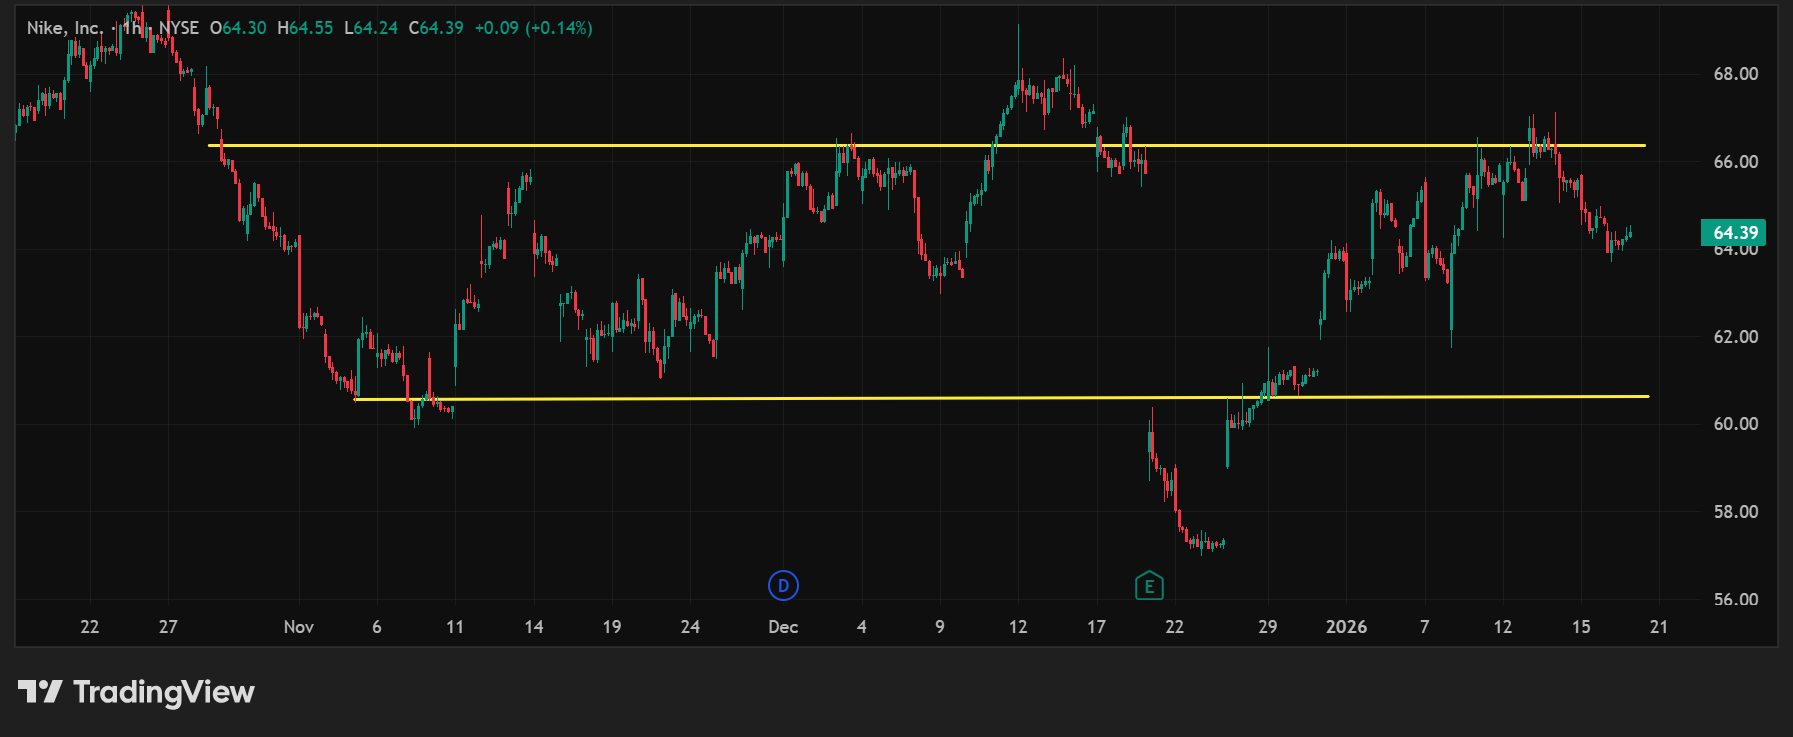
So even though the support changes for the one month in comparison to the three month chart, the resistance remains for the most part unchanged aside from a brief breakout mid December. So, at the moment, without considering volume, I'd say it is a pretty defined channel where low ~$61 and high ~$66. Let's look at the five day chart and consider the volume.
Five Day Chart
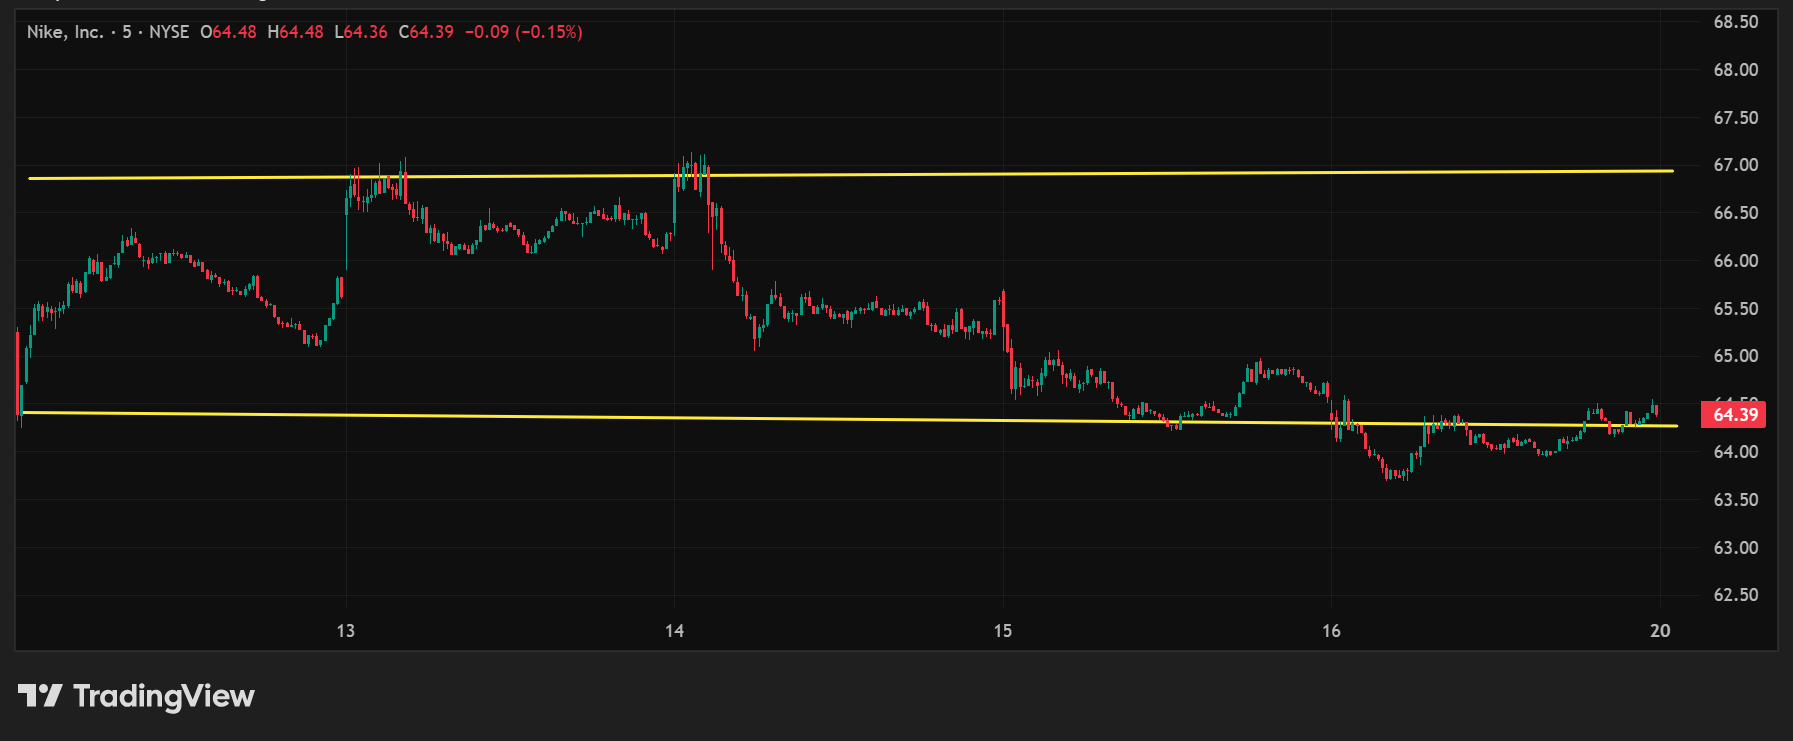
When looking at a five day chart, the support level is higher valued than when looking at a 3 and 1 month's worth of price data. On the other hand, the resistance seems to remain the same. Nevertheless, we do see that the support was broken on January 16, reaching nearly $63. We see that throughout the day, the price did not make it very far past that original support. This may indicate that $64 is the new resistance price. So, how can we determine whether investors both sellers and buyers have conviction in the price and where it's headed? We look at the trading volume.
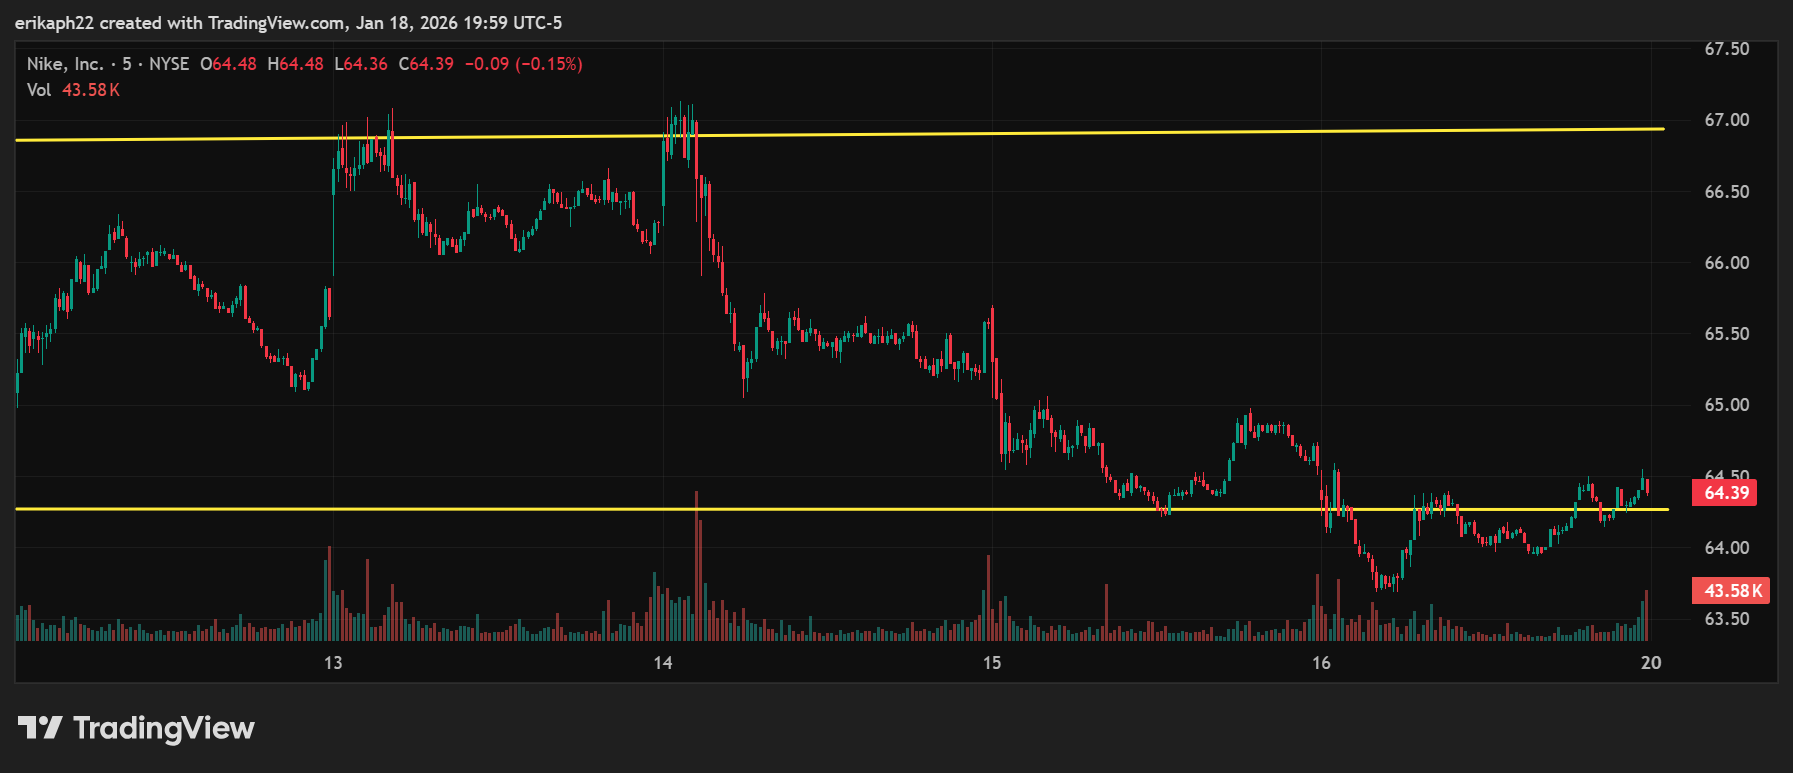
In the chart above, you will see a histogram at the bottom of the chart. This is where the volume is recorded. While the volume fluctuates with the price, it can certainly tell us about what is going on. So, we'll look at January 14 and January 16 to have a better understanding of it. On January 14, the last time the price hit the resistance, we see a high spike in the trading volume, the red bar. This immediately tells us that the sellers took over and contributed to the price drop. If we focus on the volume from then to the end of January 16, there isn't much strength coming from the buyers at any point, which tells me that the buyers aren't confident that value is set to increase.
Let's focus now on January 16. At the beginning of the day, we observe that there is a spike volume in the sellers, and as a result, it breaks support and the original channel loses relevance. As I mentioned, throughout the day we saw the price trying to break past the established support, but the last volume recorded suggests another spike in selling volume. The last trading volume bar is in the sellers favor, which tells me that the price will continue to plummet, and the highlighted support may be the new resistance.
We can continue to use the the breakout strategy on January 20 to observe whether the it is a fake-out (a false breakout). We will know this if the price goes above the established support and closes within the original channel and not outside of it.
Final thoughts
I probably say this often the more I learn everyday. I like different techniques and tools and this breakout strategy is probably my most favorite one so far. It's more telling and more informative in my opinion. The fun part of it is that I haven't even moved to triangles, flags, head and shoulders. The very basic has taught me a lot and has allowed me to understand $NKE and what has happened over the last 3 months and last 5 days.
Tomorrow is Martin Luther King Jr. Day, so the market is closed. While I will not dive on the technical since nothing new will be observed, I will write about rules I will begin setting for myself and some personal goals.
Member discussion