Divergence
We've discussed MA, EMA, RSI, and MACD in previous posts and how each can help us infer where an asset's price is headed. However, we know these indicators don't guarantee price movement. Today, we will dive into Divergence
According to investopedia, divergence is a technical analysis, and it refers to the change in price of a stock when it moves in the opposite direction of a technical indicator (RSI or MACD - discussed in the last two posts). Typically, this indicates a shift in the trend. What seems to be peculiar about divergence is that it can prematurely warn us as traders about the momentum and how it's changing.
Two divergences we will observe: positive divergence and negative divergence. A positive divergence tends to be observed when the stock reaches lower lows, but the indicator (RSI or MACD) reach higher lows, this is where a price reversal may occur and go upwards. Conversely, a negative divergence is the opposite; when the stock reaches higher prices, but the indicator reaches lower lows, then we can expect a downward shift in the momentum.
No one in the right mind will ever suggest using one tool only. We should be aiming to use more than one tool to provide the future of an asset . With this is mind, let's look at our Nike example.
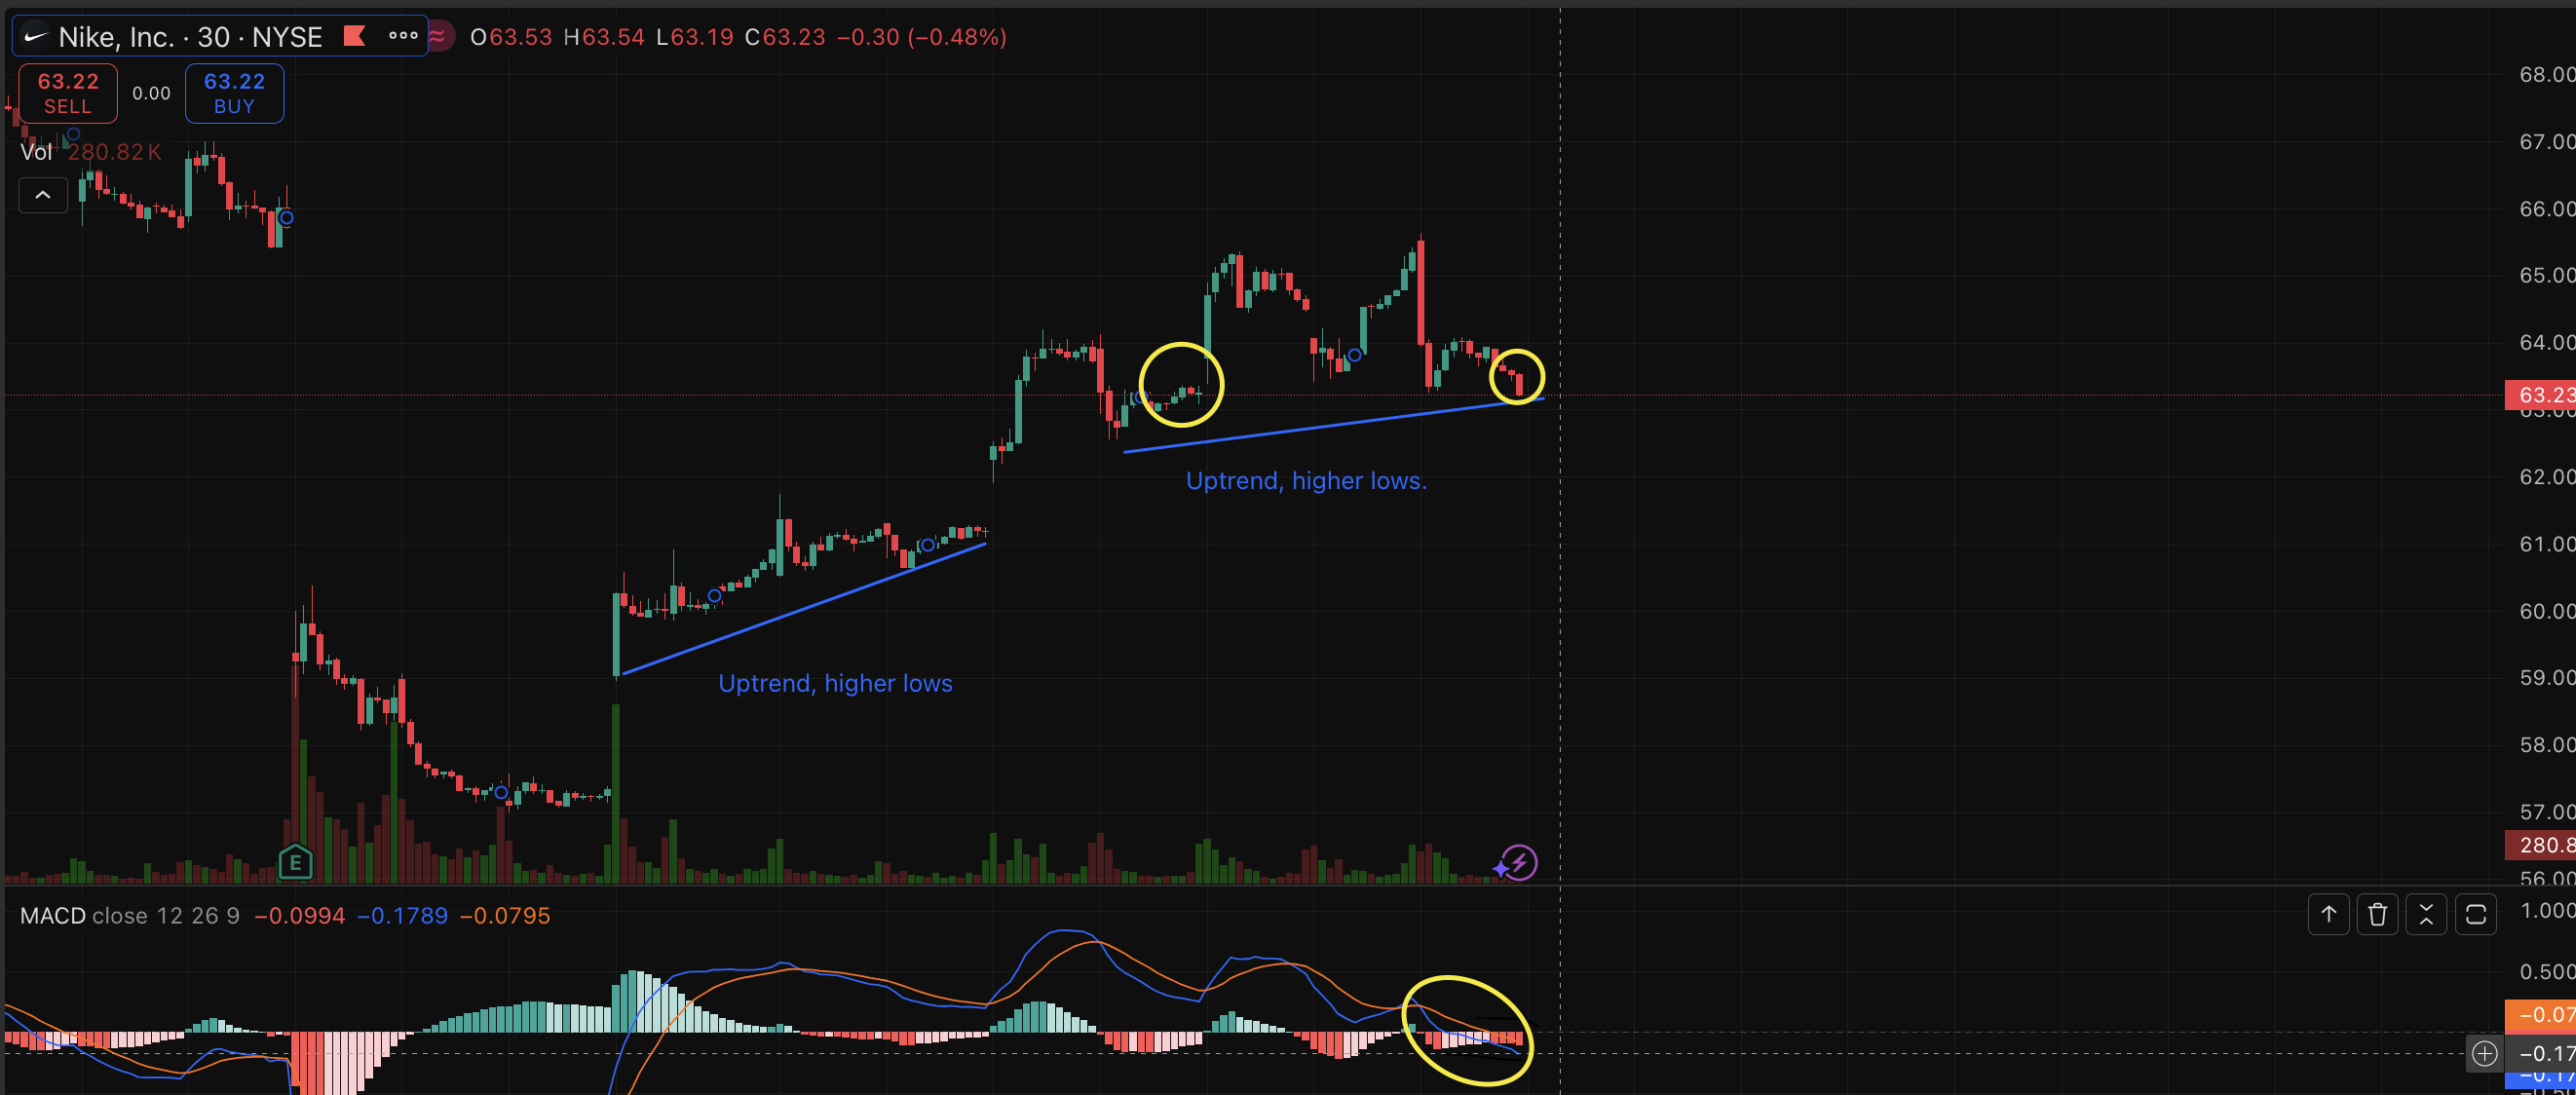
In the chart above, we can see the divergence twice as an uptrend. We know this to be true as there are higher lows. At the same time, the MACD has crossed the signal line below it which may mean a shift and a downtrend. However, because there is a bit of an uptrend, we could say that there will be a recovery and the momentum will shift upwards. Again, a positive divergence tends to be observed when the stock reaches low prices, but the indicator (RSI or MACD) reach higher lows, this is where a price reversal may occur and go upwards.
Final Thoughts
This was a quick look at divergence, but a necessary one to understand. Tomorrow, we will dive deeper into specific bullish and bearish patterns.
Member discussion