ETFs Bull's Eye
I'm not sure whether it is because I liked ETFs from the moment I discovered them or because I find them more rewarding for investment long terms, but I feel like I cracked them better.
My analysis approach targets which sector the money moves into day in and day out, and while this is great, I want to be able to go deeper to the roots of the ETFs. It's trickier, more volatile, more unpredictable I'd say as well, so this is me admitting that my current method, while a good one, needs more precision.
Perhaps this is where the charting comes? I'm not too sure, but I'm willing to find the bull's eyes within the ETFs. Before we move on to them, let's look at yesterday's prediction and today's performance.
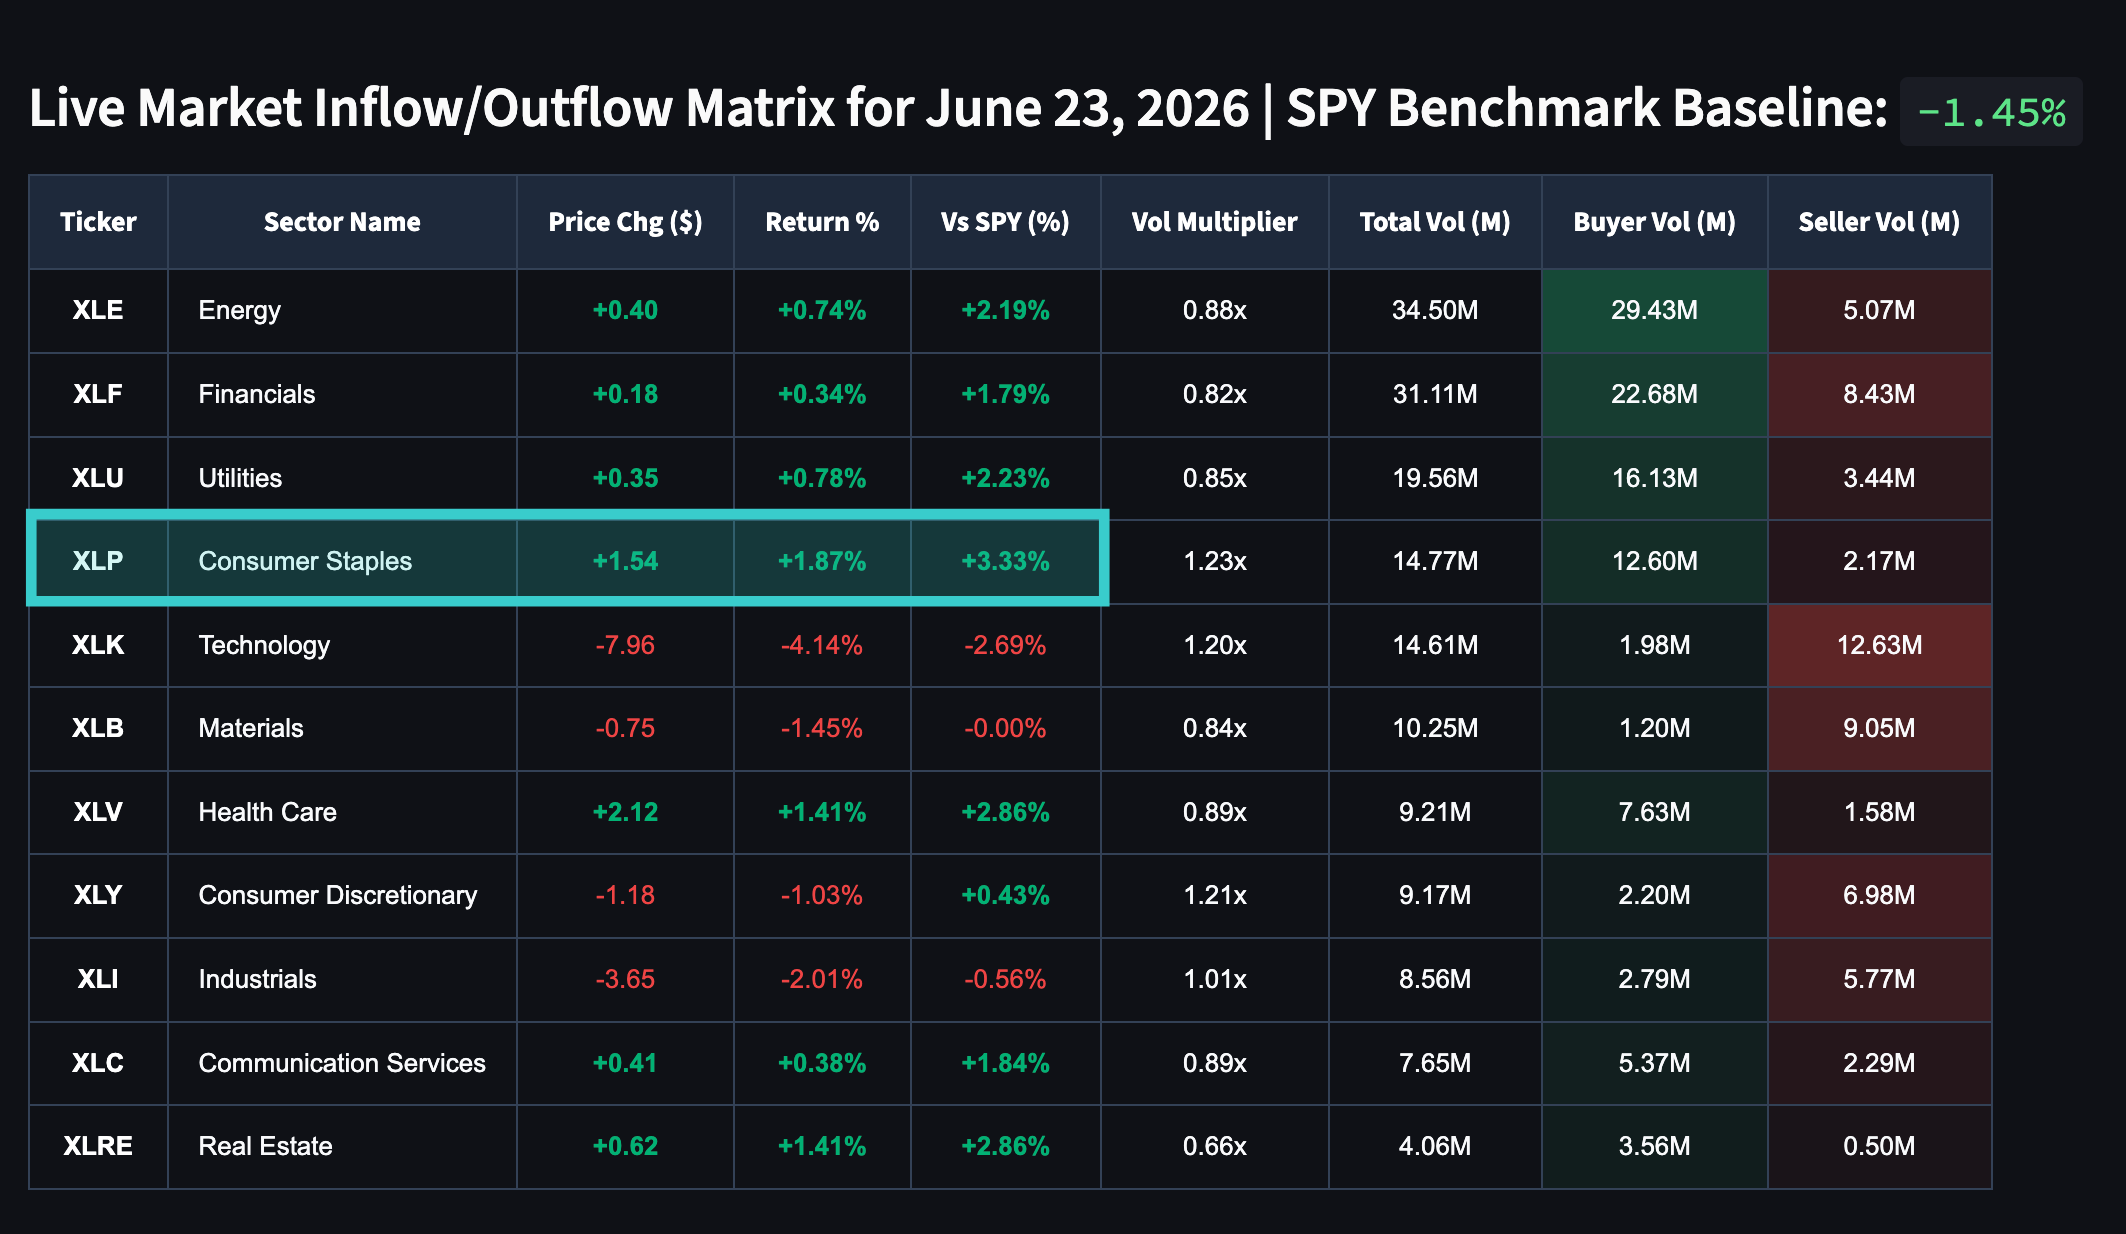
Yesterday, my model predicted that XLP and XLY would have a green day, and sure enough, XLP had the highest return with a 1.87% change. So as shown above, XLY was in the red today, so I want to dig into it a bit deeper and look at its chart from today.
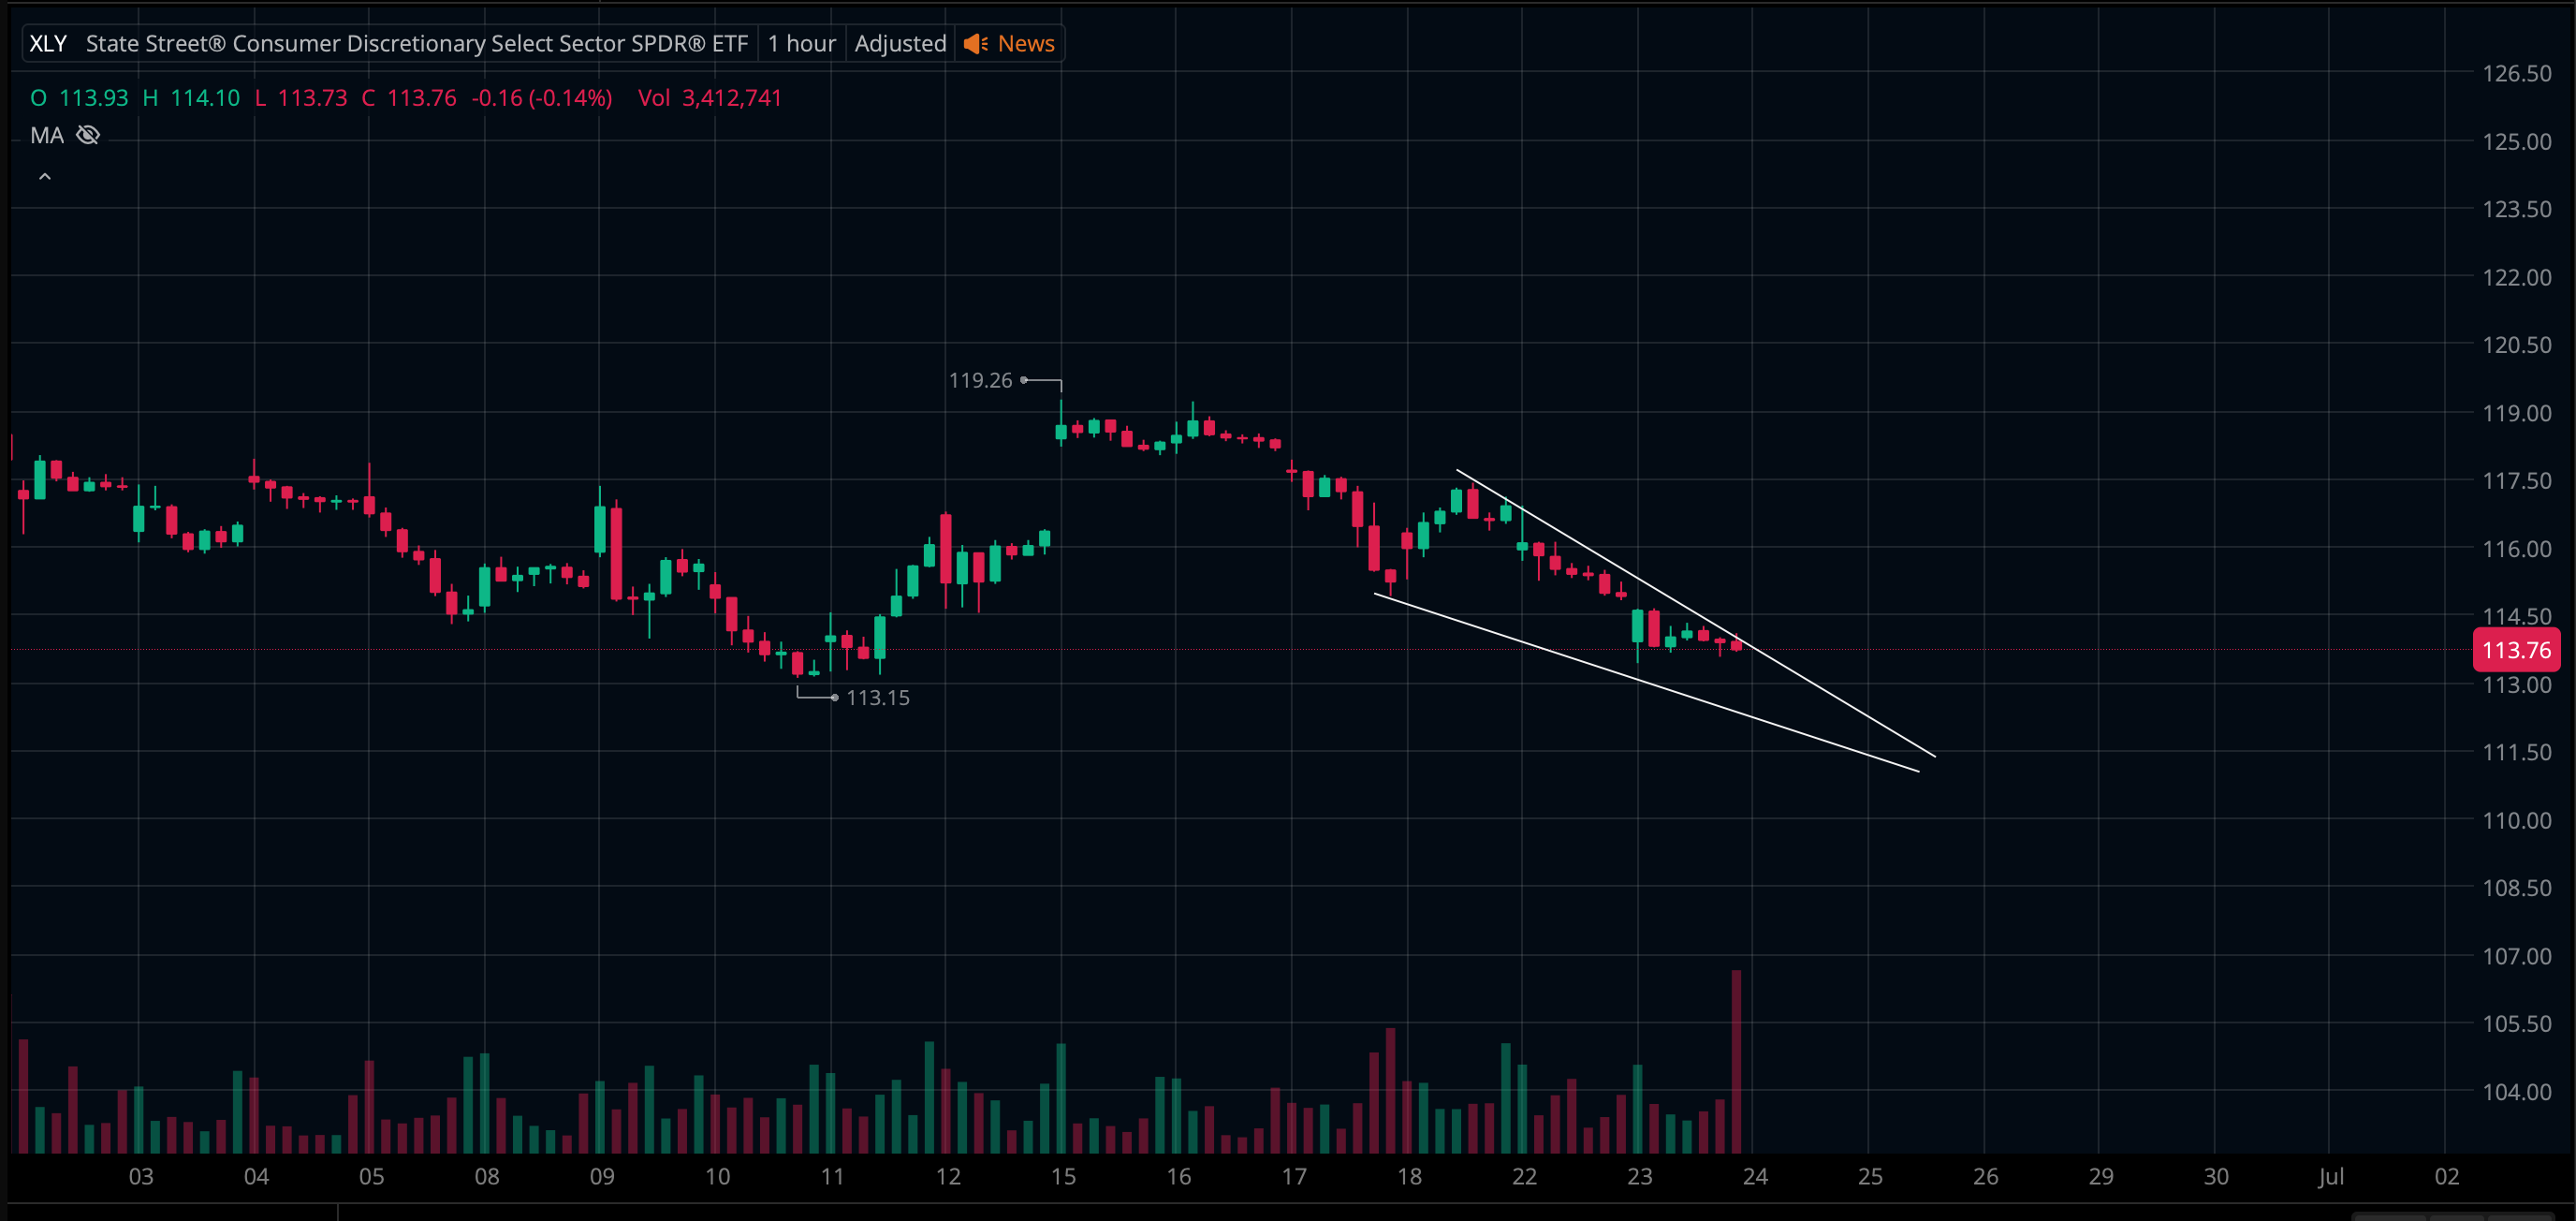
If we look at the above, we see that falling wedge taking place, which started around June 18 and if the wedge is correct, then we may see it falling up until June 25 before it reverses.
So, now that we've seen this, let's move on to tomorrow's outlook for ETFs. Considering the volume and patterns, I'll say XLY and XLB are great prospects for tomorrow, and XLF may see a reversal in the middle of the day going into June 25, I say this because of the below:
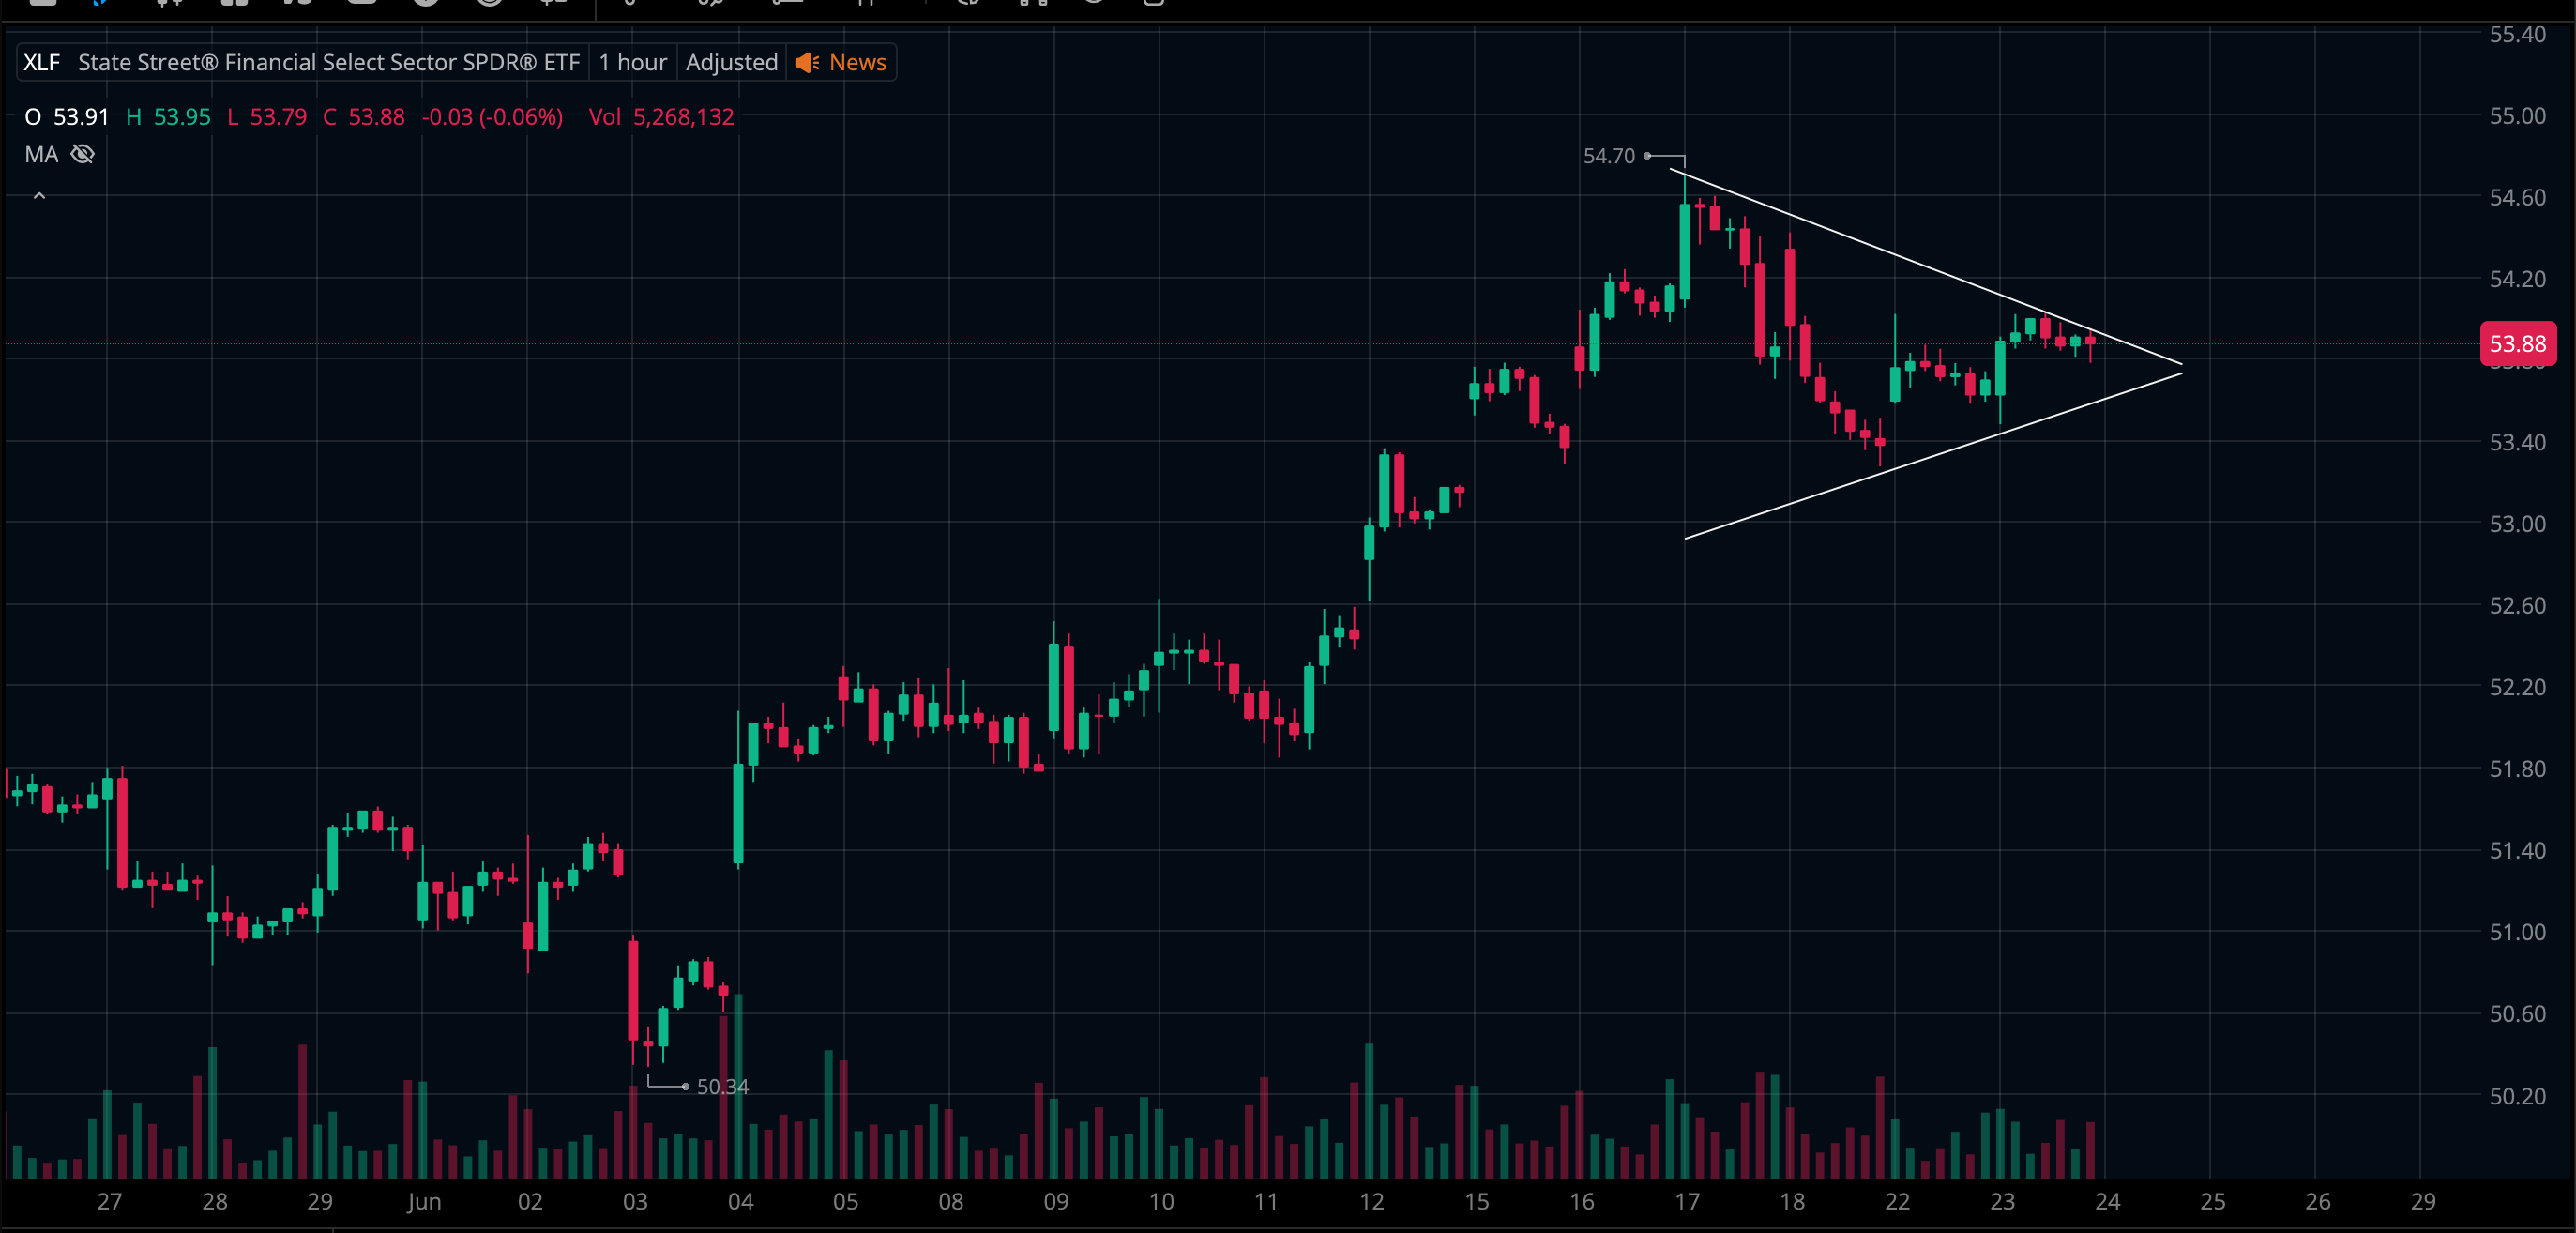
If the above is true, I'd consider JPM for $338-340 target like below
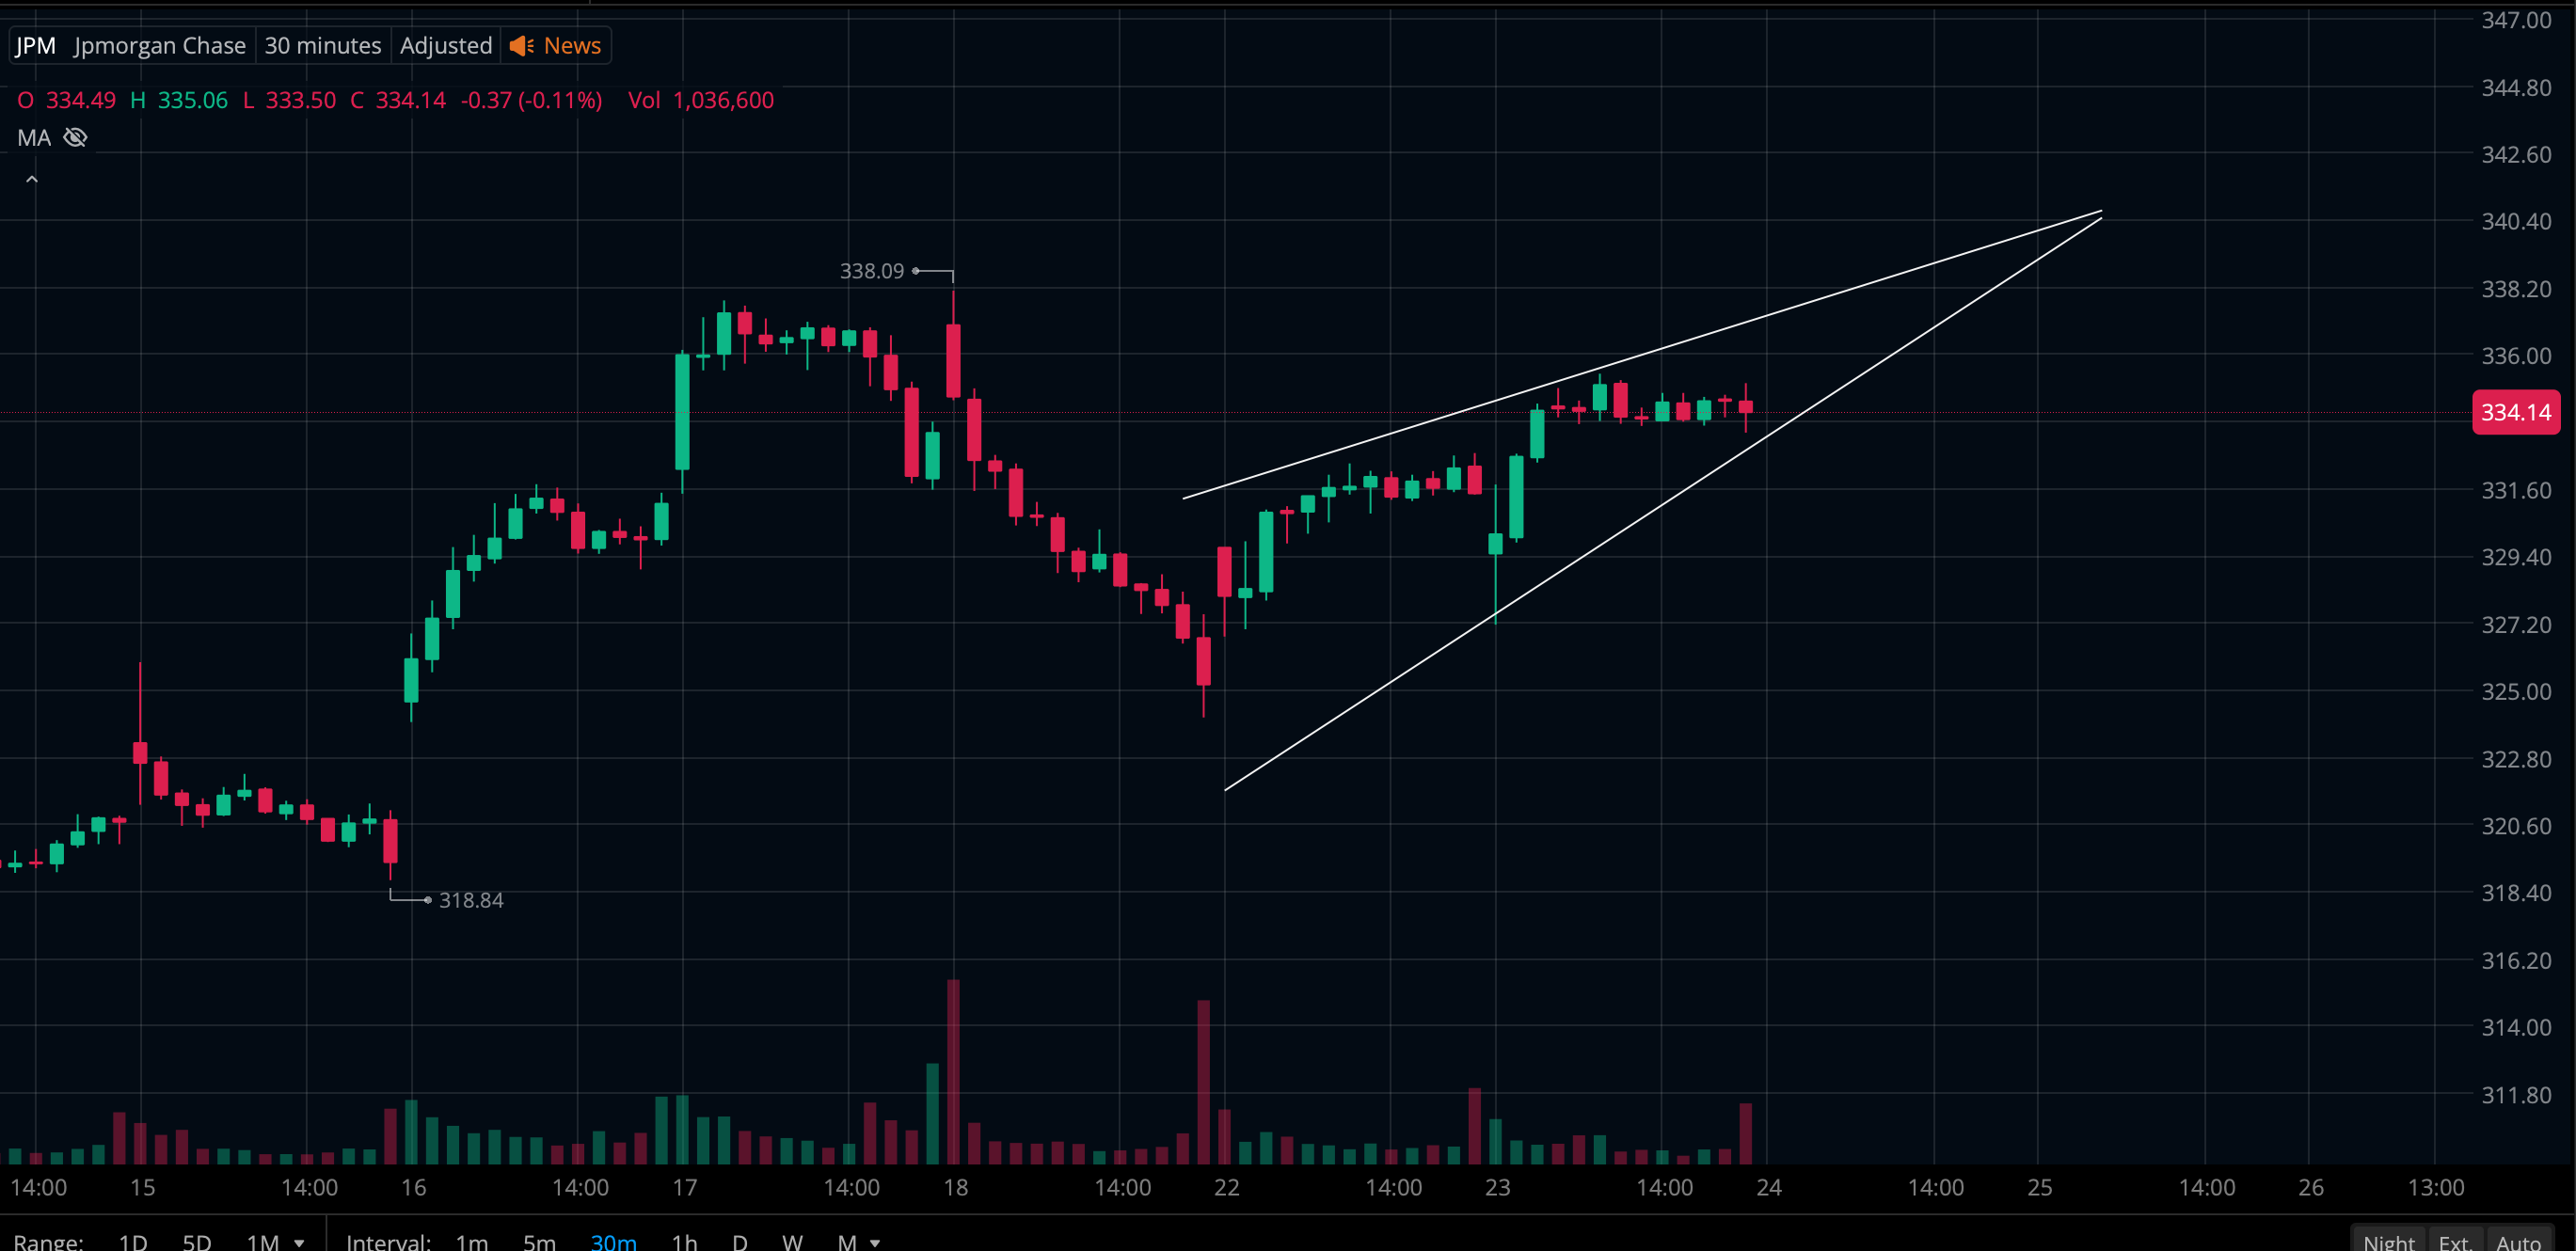
As mentioned, while my analysis on ETFs day in and day out is pretty solid, aside from special events like ex dividend dates, the individual stocks are my greatest challenge at the moment. This approach of charting is new, it is something I need to work on, I do think I need to consider volume and price like I was doing in the past + charting so until I find a good set up, I'll refrain from trading.
Let's see what we get down to tomorrow!
Member discussion