Momentum Measurements in Stocks - Part One (RSI)
There are various technical analyses that we can use in the stock market as investors and traders. In the previous post I discussed SMA (simple moving average) & EMA (exponential moving average). Today, we will be looking at momentum measurements as tools. These two measurements are: Relative Strength Index (RSI) and Moving Average Convergence Divergence (MACD). Today we will cover RSI only.
RSI
RSI is used as an oscillating indicator in the stock market to try to identify where a stock's price is headed. The RSI moves between a bound of 0-100, where traders tend to rely on 30 and 70 to determine if a stock has been overbought or oversold. – This doesn't mean we can't use 20 and 80 bound to draw conclusions. In fact, the 20-80 bound can be utilized if the RSI is consistently hitting above 70 or below 30 to get a more grounded estimation – If the RSI crosses above the 70 mark, then the stock is deemed as overbought; on the flip side, if the RSI falls below 30, the stock then is considered oversold. So, what does this mean?
Understanding the RSI and overbought/oversold conditions can help us speculate whether the trend is going to shift upwards or downwards. From what I’ve gathered, it seems that sometimes there are scenarios where if there is an uptrend, then the RSI will continuously hit 70 and remain above 30. Similarly, when a strong downtrend is observed we should expect the RSI to remain below 70 and constantly see it hit 30.
So, I will now use the formula to calculate the RSI for $NKE. Typically to calculate the RSI, traders or analysts if you will, is a 14 day window, while you can expand or shorten the period of time, 14 is the most common period used.
RSI = 100 /(1 + RS)
RS = Average gain/Average loss
So now I will calculate the Average Gain and Average loss for $NKE from December 12, 2025 - January 5, 2026
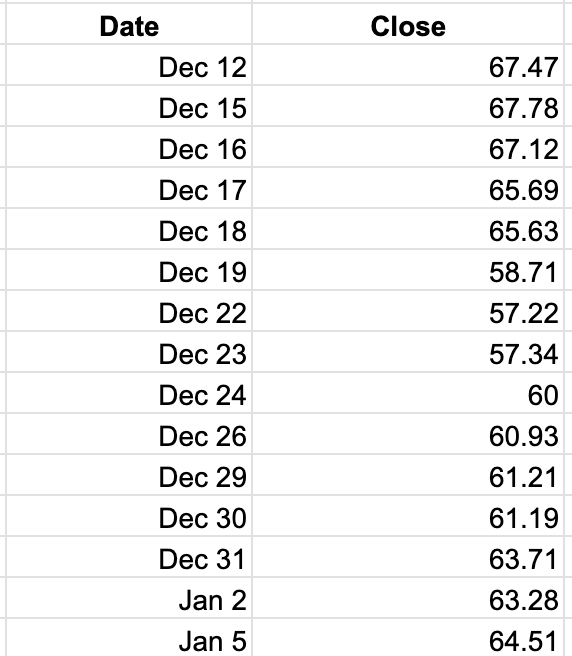
Now that we’ve obtained the close price for the time period, we can calculate the RSI and we will start by calculating the gain & loss per day. To do this, we subtract the yesterday’s price from today’s price. See below:
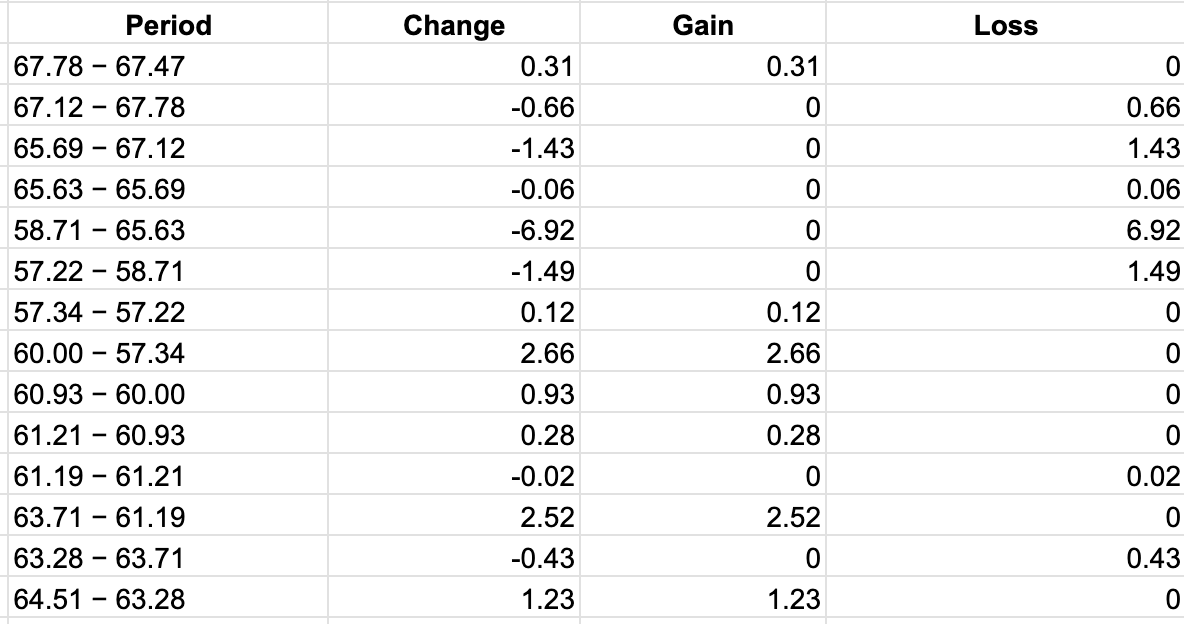
Now, we can calculate the RS = Average Gain/Average Loss. The average gain over 14 days is 8.05/14 = 0.575 – The average loss over 14 days is 11.01/14 = 0.786 when put into the formula RS = 0.575/0.786 = 0.73
RSI = 100 -(100/(1+0.73)) = RSI= 42.2
This indicates that it is neither overbought nor oversold, and we can look at the chart from TradeView below with the RSI, it will differ slightly as we are looking at 30 mins breakdown per day.
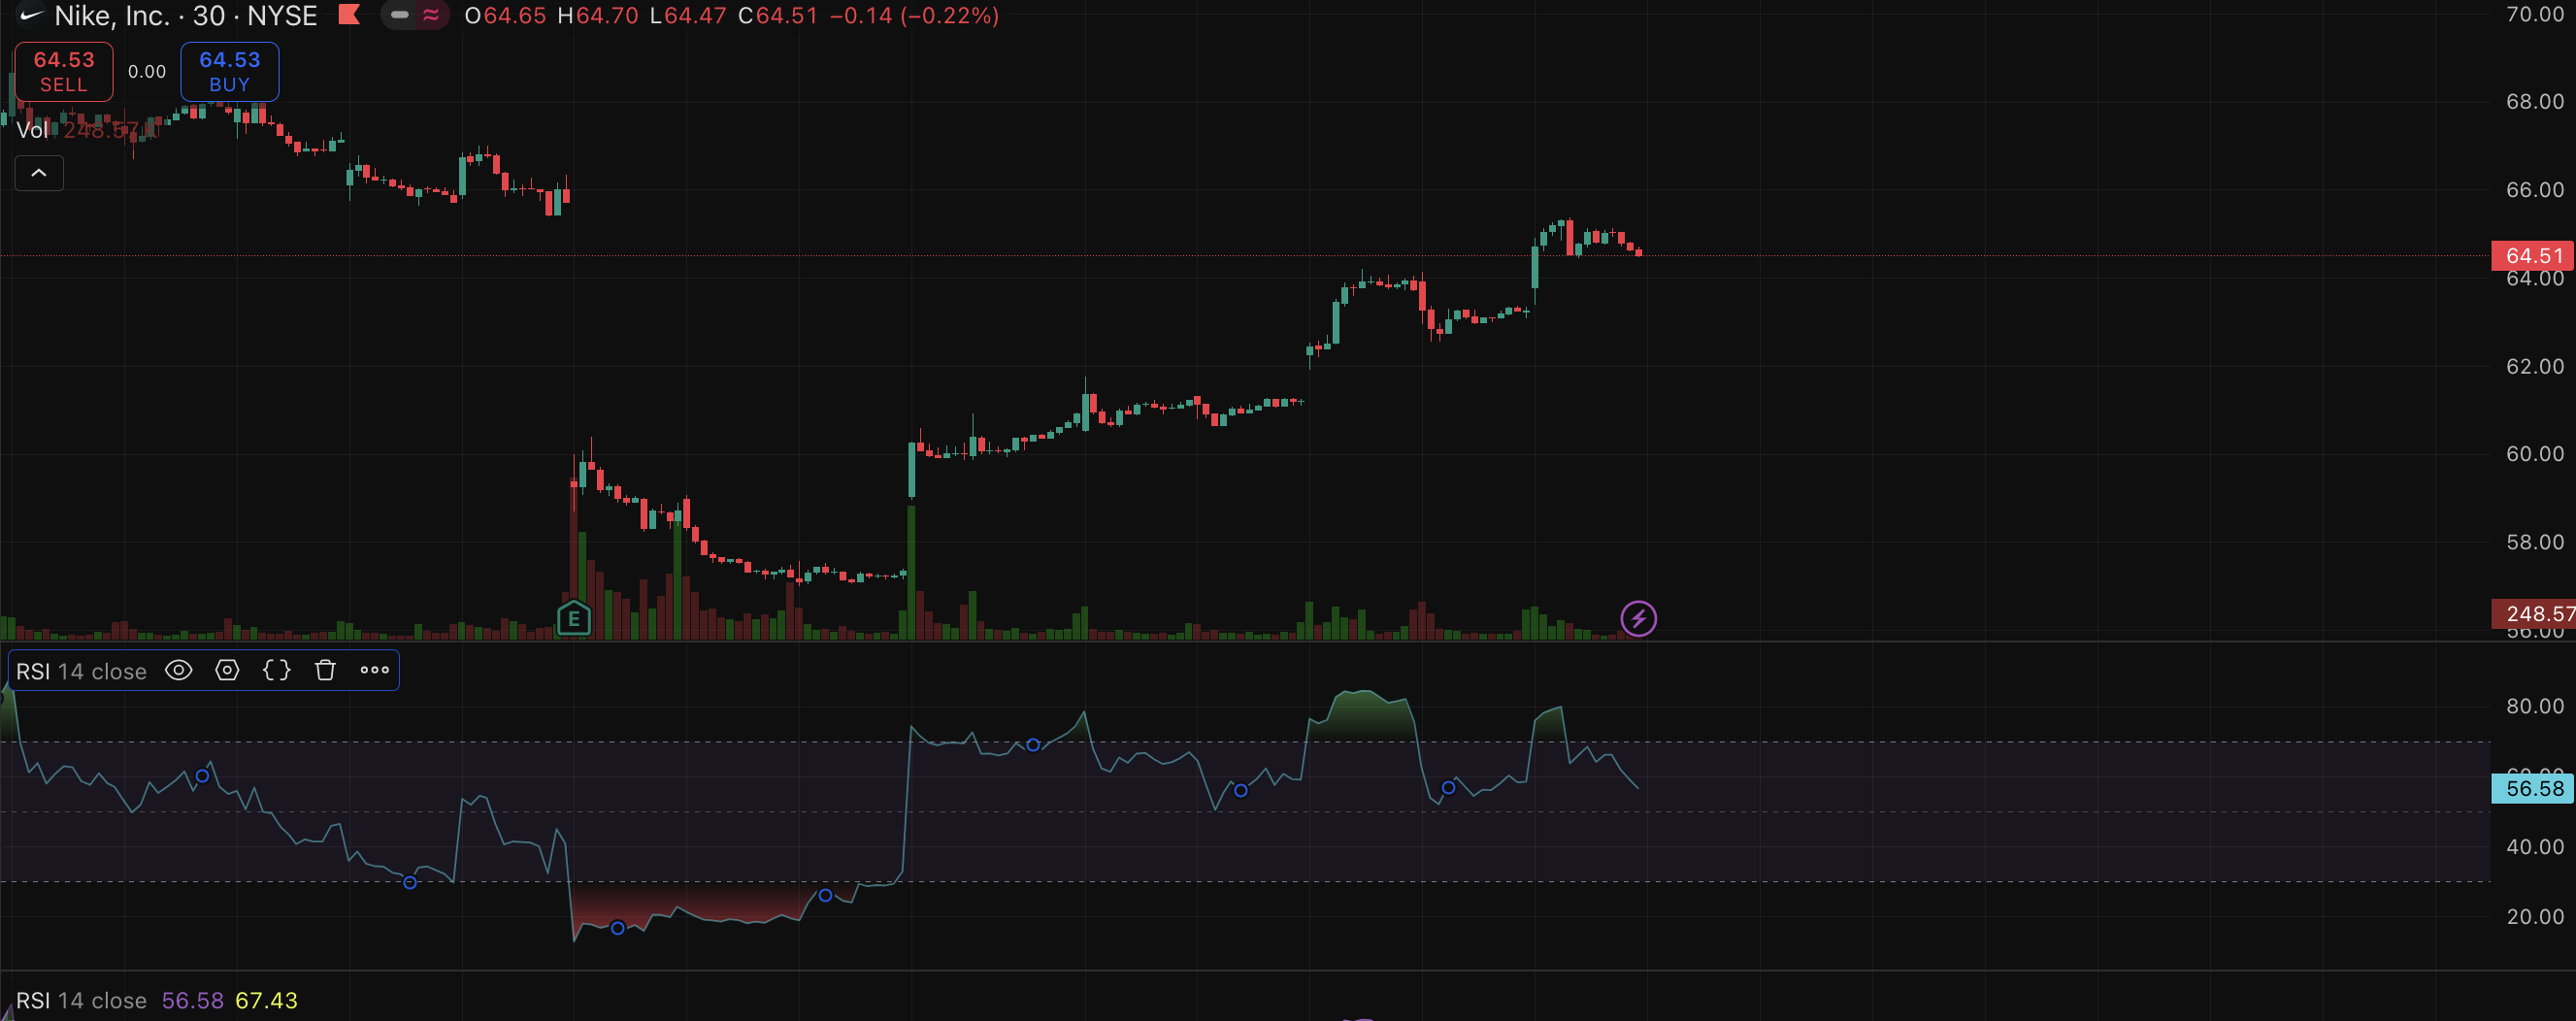
As shown in the chart above, we see that the RSI has hit 70 in at least 4 occasions in the last days. However, it never falls below 30, which suggests a strong uptrend as stated earlier. While this may suggest a bearish momentum, meaning it will likely drop, it also suggests recovery from a previous oversold period.
If I were to look at the SMA (Simple Moving Average) from my day two post where we determined that the 5 day SMA was $62.06 and closing price on January 2 was $63.28, then I assumed there would be an uptrend. On January 5, we noticed the price increase and it closed at $64.51 – In the coming days I will be deep diving in how to better utilize SMA, EMA, and RSI to create better analyses on charts and their trends. In the meantime, if I were to guesstimate, I would believe that the stock will continue to increase based on the last 5-day SMA and RSI =42.2, but this increase will be slow. Once again, full disclosure, I am learning as I go so my guesstimate based on 5 days of knowledge may not hold.
Final thoughts and call option $NKE update
As mentioned in the last post, we all expected the oil stocks to be booming on January 5. As a result, I funded my brokerage account to purchase Chevron. In another post I will be sharing the growth in Oracle, Nvidia, and Chevron.
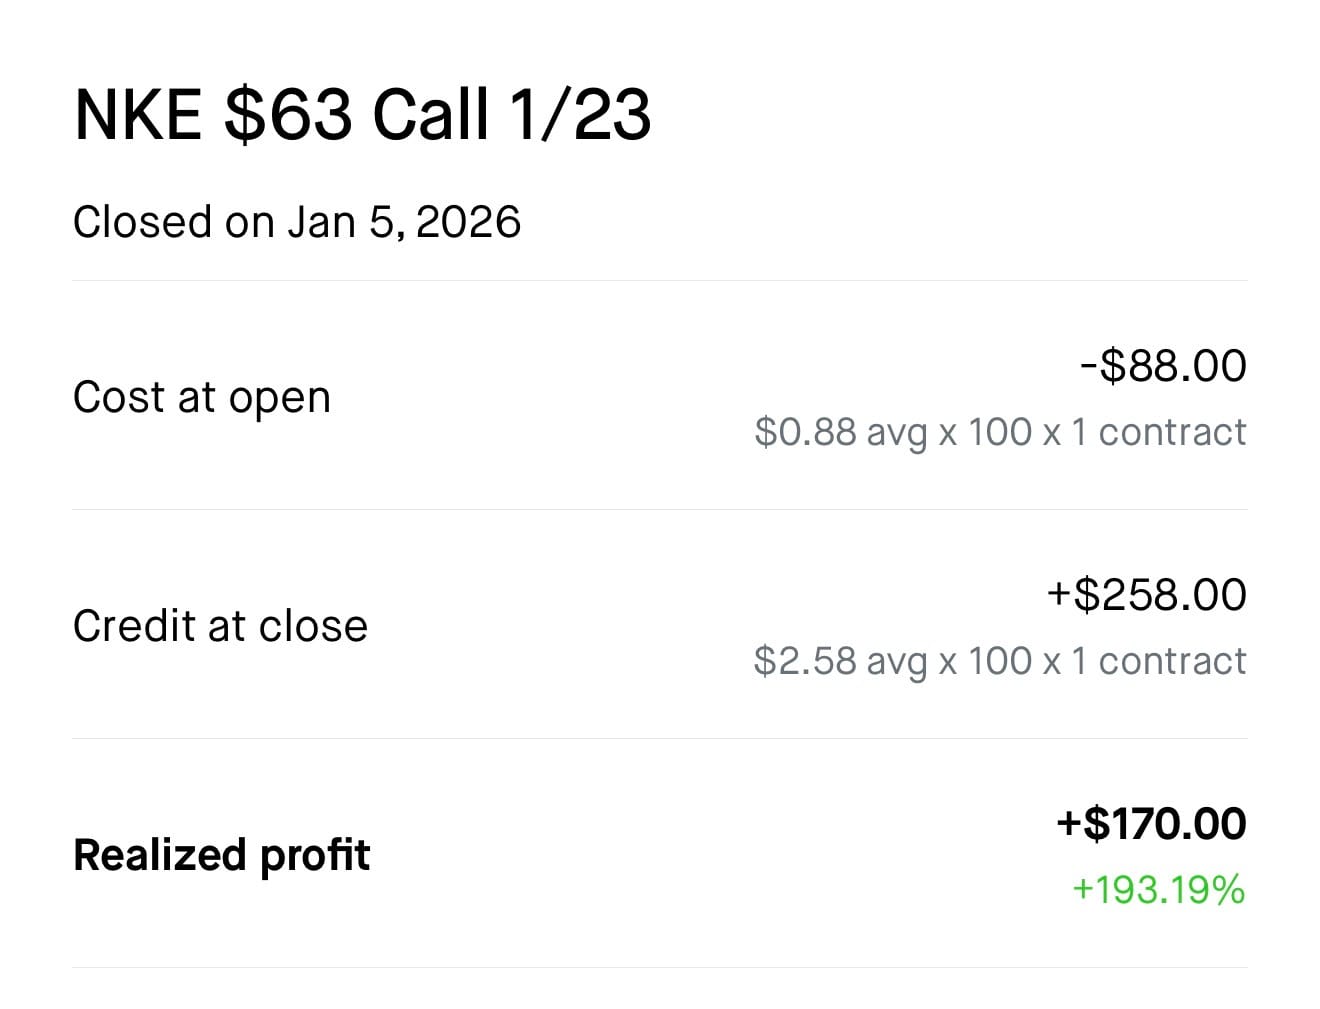
The next update is on $NKE, my call option set to expire on January 23. I opened the contract when the price was at $60.00 and the call was made for $63 the break-even price then would be $63.88 where I can start making profit. Today, January 5, we saw the highest price go to $65.37 and a close price of $64.55.
As mentioned at the beginning of this journey, in the past I held on to my contracts chasing "big money" so today I sold it at $64.60 and made $170 profit for one contract.
I feel good about it. Though I made the decision to open another contract for $66 expiring on January 23. My break-even price will be $67.50 so we will continue to use Nike as the example as we navigate my journey.
Tomorrow I will continue the conversation on momentum measurements and will focus on Moving Average Convergence Divergence (MACD) as we covered RSI today.
Exciting times ahead :)
Member discussion