Momentum Measurements in Stocks - Part Two (MACD)
I initially didn't expect the momentum measurements in stocks to be a series, but here we are and today I will be discussing Moving Average Convergence Divergence (MACD).
What is MACD? Think of MACD as a speedometer. It basically tells us whether the current trend observed can keep going or whether it is likely to reverse. It can be used as a tool for traders to identify entry or exit point. The MACD is considered a lagging indicator; and it is composed of three parts: MACD line, signal line, and MACD histogram.
MACD line
The MACD line is the calculation between two exponential moving averages (EMA discussion), this calculation is taken from the difference between a 12 day EMA and 26 day EMA. The formula being: MACD = 12 period EMA - 26 period EMA. To keep consistency going, we will calculate the MACD for Nike before we move on to the next parts of MACD.
26 Day EMA using the formula EMA = (Current Price - Previous EMA)*K + Previous EMA. Where K= 2/(Day period) + 1 and previous EMA is the SMA (sum of close prices divided by period of time). Please note that if I were constantly monitoring the EMA, I would use yesterday's EMA and not the SMA.
K = 2/26+1 = 2/27 = 0.0741 and now we can rely on the data below:
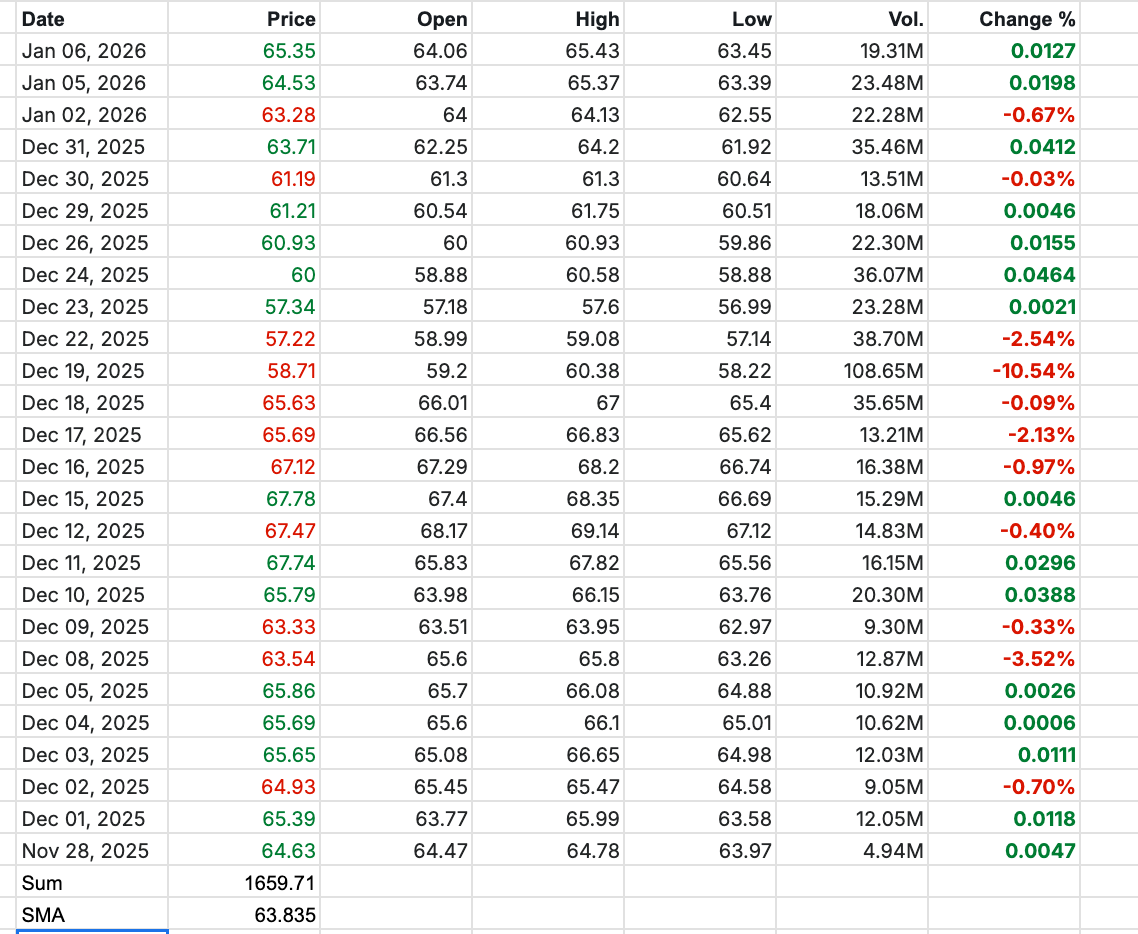
EMA 26 days= (65.35 - 63.835)*0.0741 + 63.835 = ~$63.95
We will do the same for the 12 day EMA, but because I've got enough data to do this above, I will simply calculate it here using the sum price December 18 - January 6/12.
K=2/12+1 = 2/13 = 0.1538, and the SMA for 12 days = ~61.60
EMA 12 days = (65.35 - 61.60)*0.1538 + 61.60 = ~62.17
MACD = 62.17 - 63.95 = -1.78
Signal Line
The Signal Line is a 9-day EMA, but with a twist: instead of smoothing out the stock price, it smooths out the MACD line itself. This acts as a "slower" version of the MACD to help us filter out the noise and identify true trend reversals.
To calculate this, we use our EMA formula again, but we replace "Price" with the "MACD value." Our smoothing constant K for a 9-day period is:
K = 2 / (9 + 1) = 0.2
The formula looks like this:
Signal Line = (Today's MACD - Yesterday's Signal Line) × 0.2 + Yesterday's Signal Line
Because the Signal Line is an average of the MACD (which we calculated as -1.78), it will always trail slightly behind. For example, if yesterday’s Signal Line was -1.90, our calculation would be:
(-1.78 - (-1.90))* 0.2 + (-1.90) = -1.876
Histogram
The histogram is the last part of MACD, this is simply the subtraction of MACD Line – Signal Line. While we won't be doing the calculation for every day nor charting it ourselves, we should know that the histogram gets drawn across a zero line.
So, when the MACD line is above the Signal line, then the histogram will be positive indicating an uptrend momentum. Conversely, when the MACD line goes below the signal line, the histogram falls under the zero line reflecting a downward momentum.
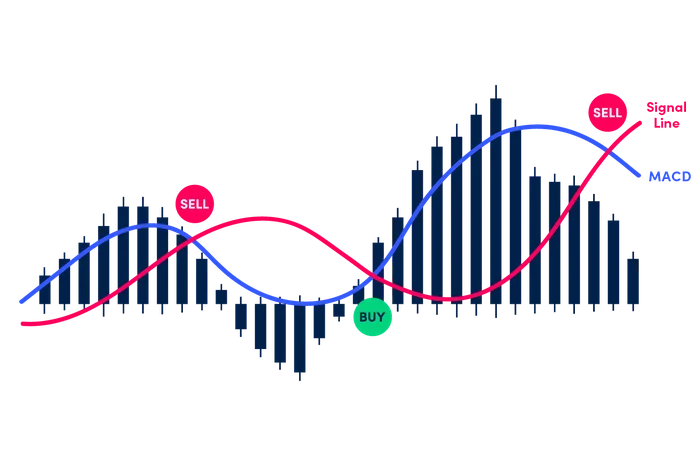
So, back to how MACD can determine entry/exit points. When looking at the chart above, we can see that the moment the MACD Line intersects the Signal Line and goes below it, then we expect a downtrend and traders exit here (sell). The opposite is observed when the MACD line crosses the Signal Line and moves above it, we begin to see an uptrend and it is here where traders enter the trade (buy).
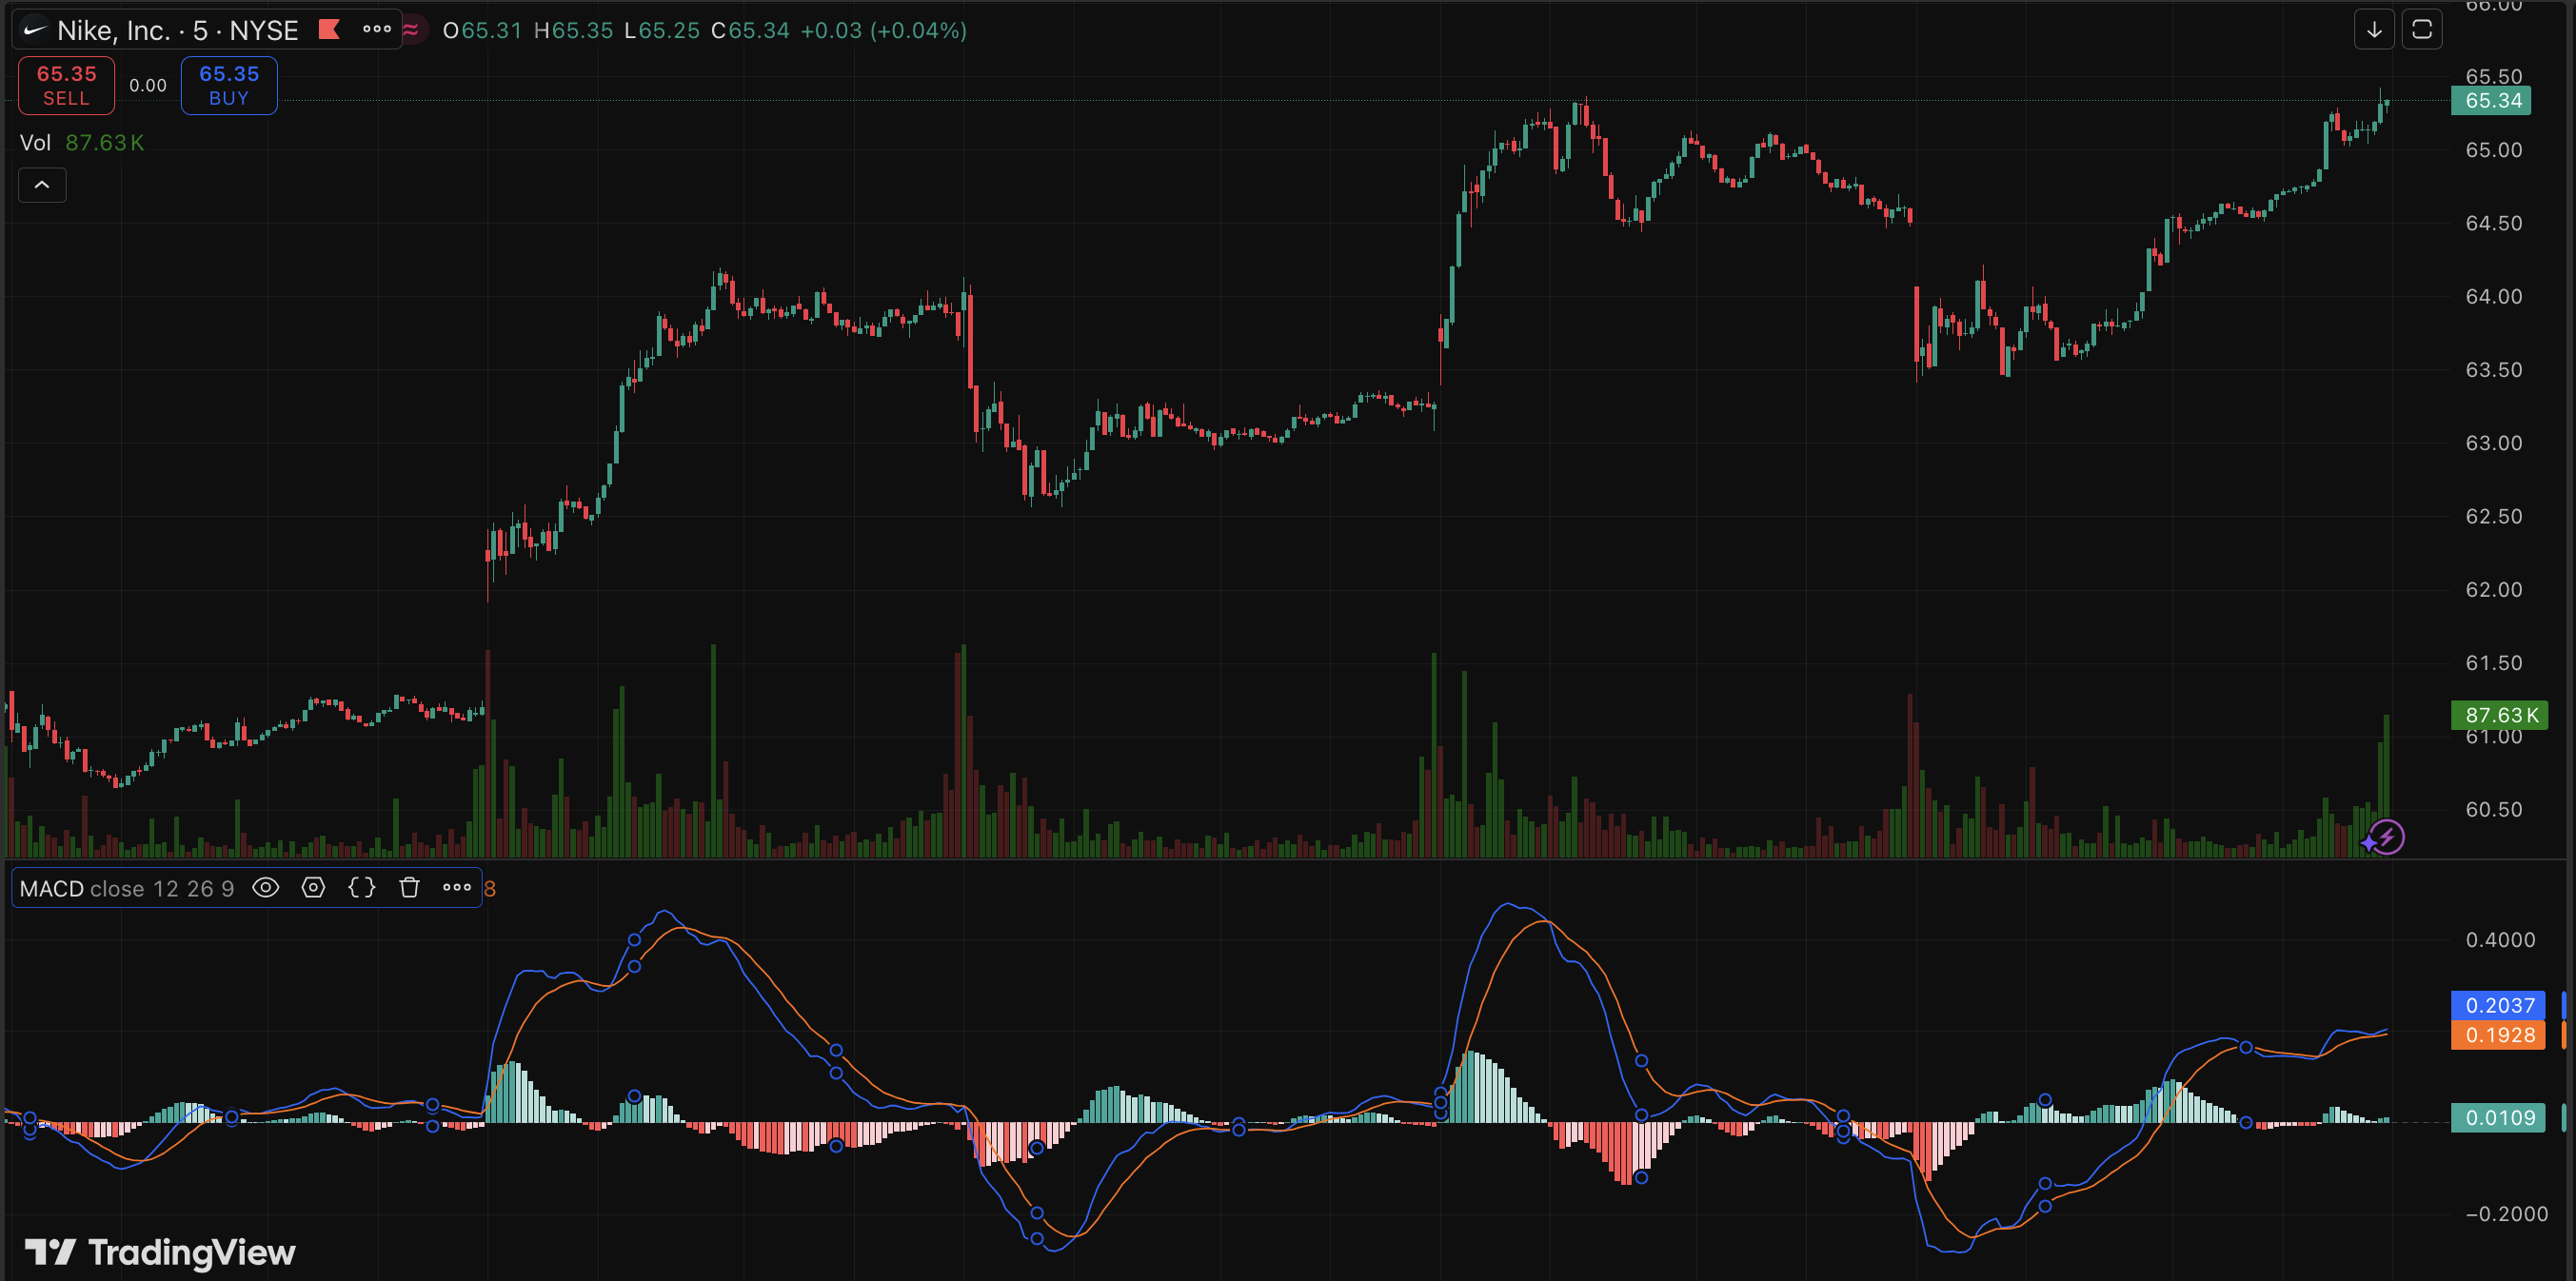
So when looking at our Nike stock's MACD through tradingview.com, we can clearly see that the MACD line (blue line) is above the Signal line (orange). This indicates an uptrend in my books! If we were to analyze the chart alone based on a pattern, we could expect the MACD to drop slightly before it shoots up again, but I certainly do not expect it to go below the zero line.
Final Thoughts
Today's post has felt rather short in words and more technical. However, today's learning on MACD taught me a lot and I feel positive about Nike's stock price. I think it was great to be able to use SMA and EMA again and their calculation, it felt refreshing.
As a reminder, my new option call contract is for $66 expiring on January 23 where I need a break-even price of $67.50 to begin profit realization. I give it until next week to have this realized, but we will see.
Member discussion