Nike Performance Analysis
In the last three blog posts I've covered the three candlestick patterns: Inside bar, engulfing pattern, and pin bar. While I've gotten a good understanding of each one of them and have used it for my open contract, today I want to cover the $NKE's performance on January 15, 2026 and want to use the three setups plus RSI and MACD to get a good understanding. However, I don't plan on using all the techniques when I start trading more.
$NKE Call Option $66 expiring on January 23. On January 15, the performance was as followed: Open $65.76 & Close $64.59
RSI
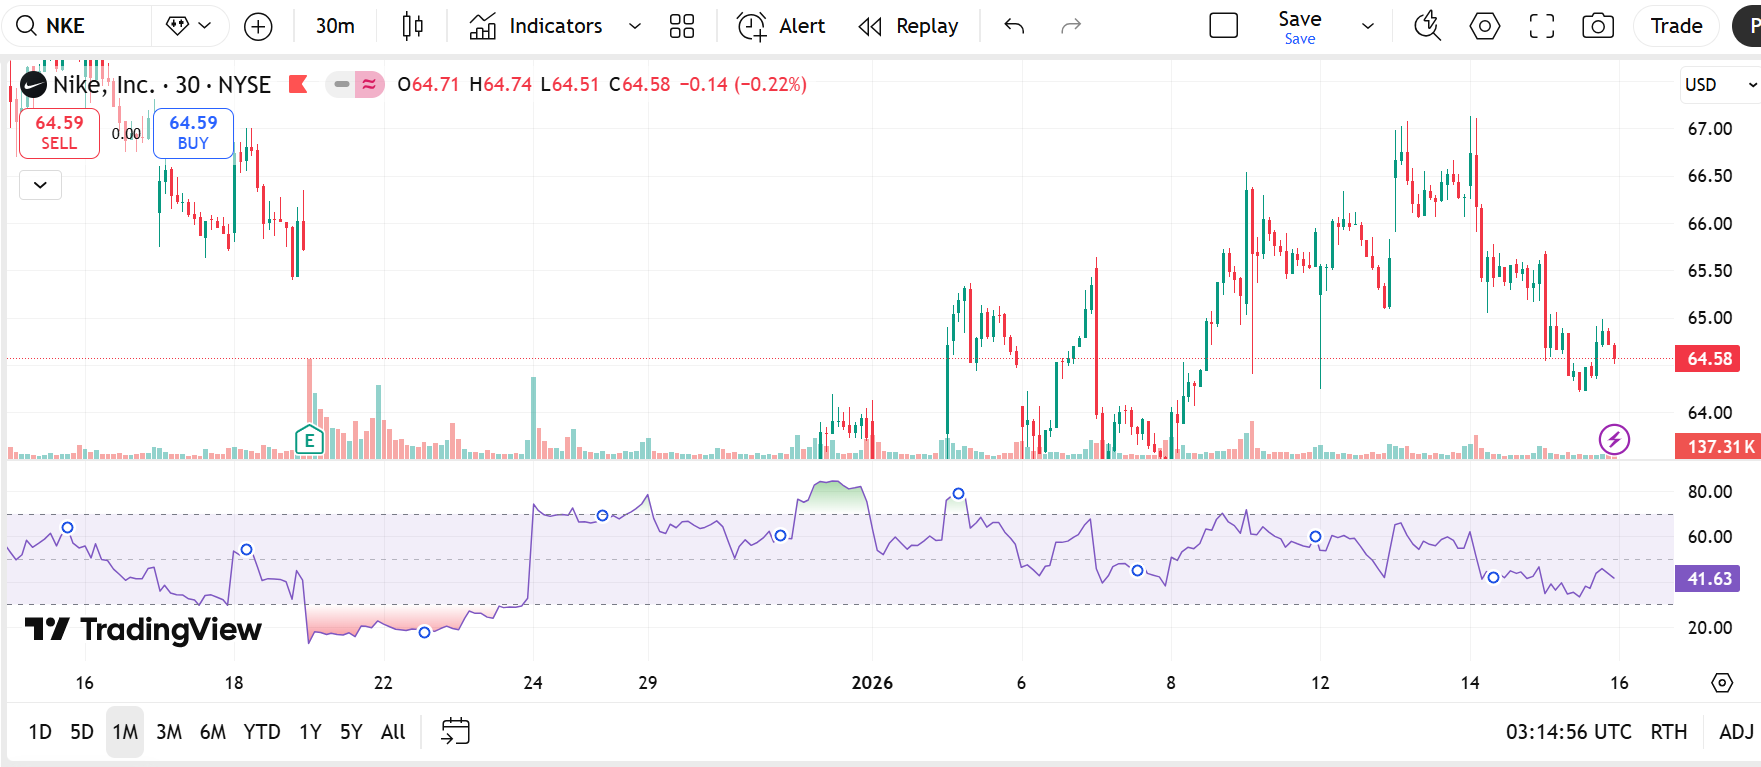
As shown above using the RSI, it is relatively low but not necessarily in an oversold position. If we look at the historical data for it and look at December 18-24, we can certainly see that when presented with a similar scenario, the price continued to go lower and went below the 30 threshold signaling oversold. So, I could expect it to go lower if I look at that pattern, but, we have also seen that from the beginning of 2026 to now, there hasn't been constant 70s bound, which means that the buyers might take over again, but I'll consider all the tools I've learned so far.
MACD
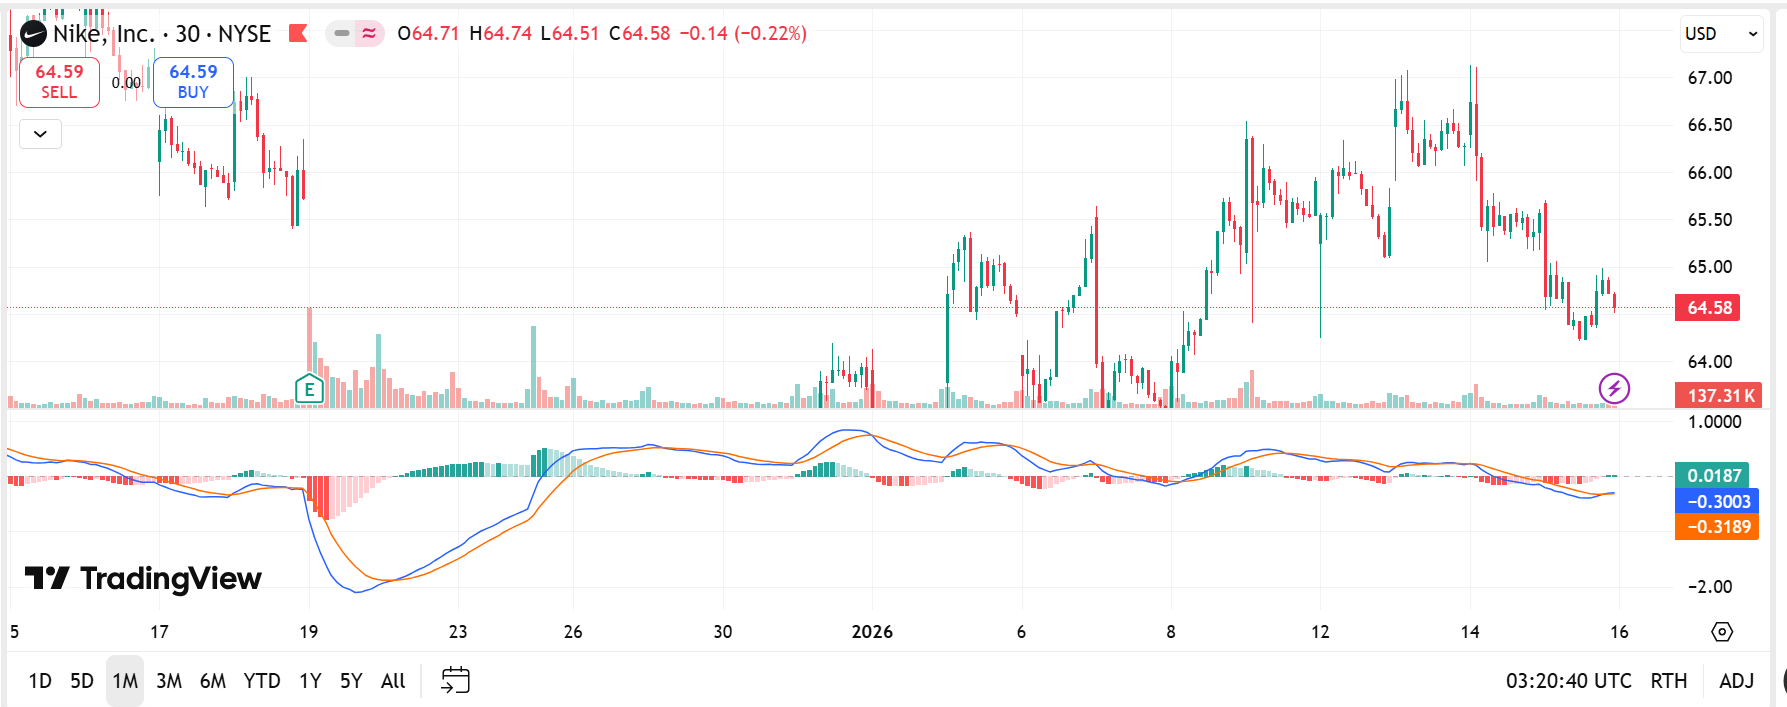
The MACD analysis is interesting to me. If we look at the dates from January 6 - January 15, we see the signal line and the MACD line struggling to "overpower" one another, they remain relatively close together and their "crossing" is short-lived. It's quite hard to predict what might happen just by reading it, but it may be the case that it goes a bit lower or remain the roughly the same price. To me, it seems that investors, both buyers and sellers are struggling to come to terms on what the real current value of $NKE is.
Engulfing Setup
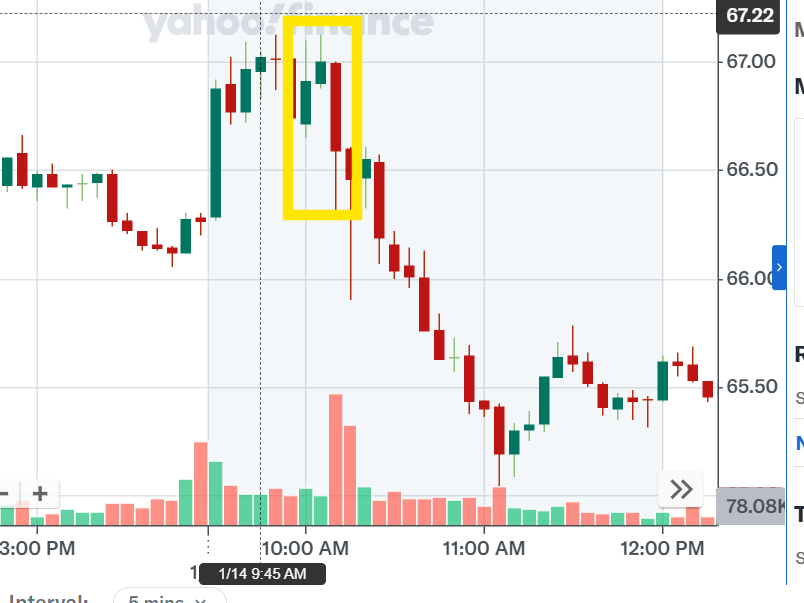
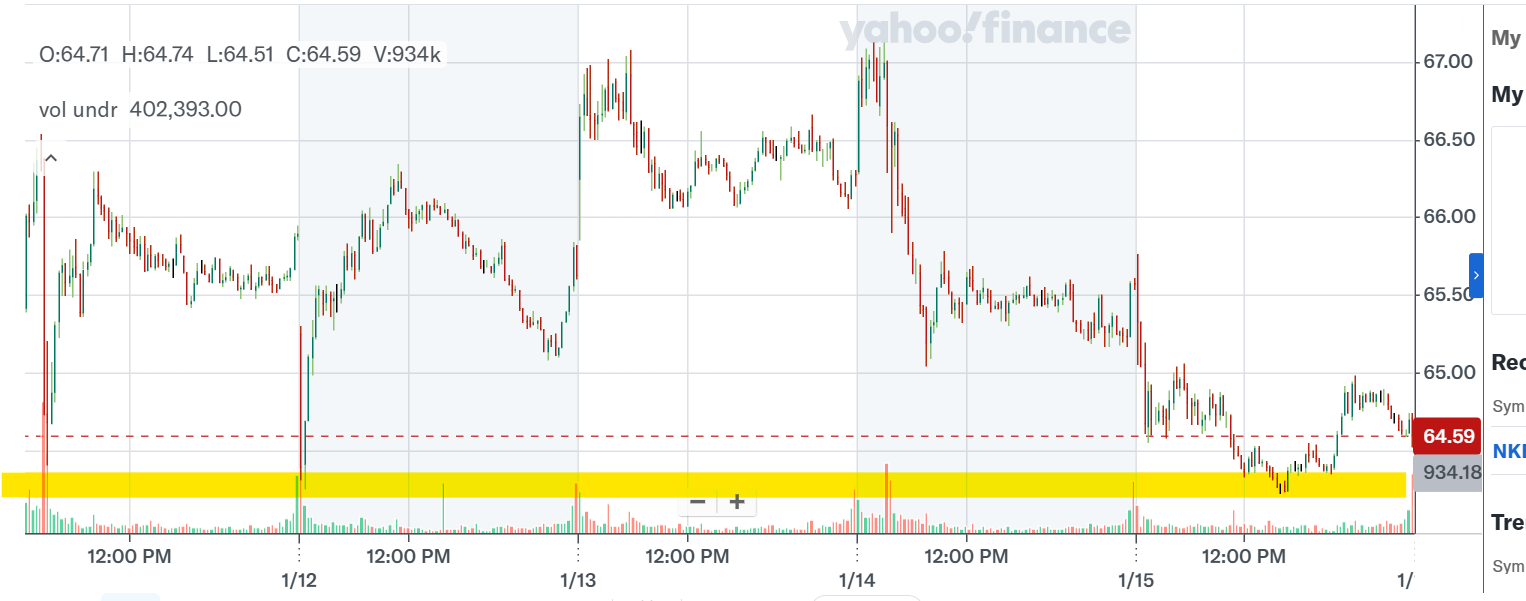
If we look at the zoomed in version of $NKE for January 14, we can notably tell that a bearish moment was approaching on January 15. I've highlighted the engulfing moment when it opened on the the 14th. At the same time, if I look at 5 days worth of price data, I can see that there is a support for ~$64.20 so I want to believe that it will not go lower than that. See the support highlighted below:
Inside Bar
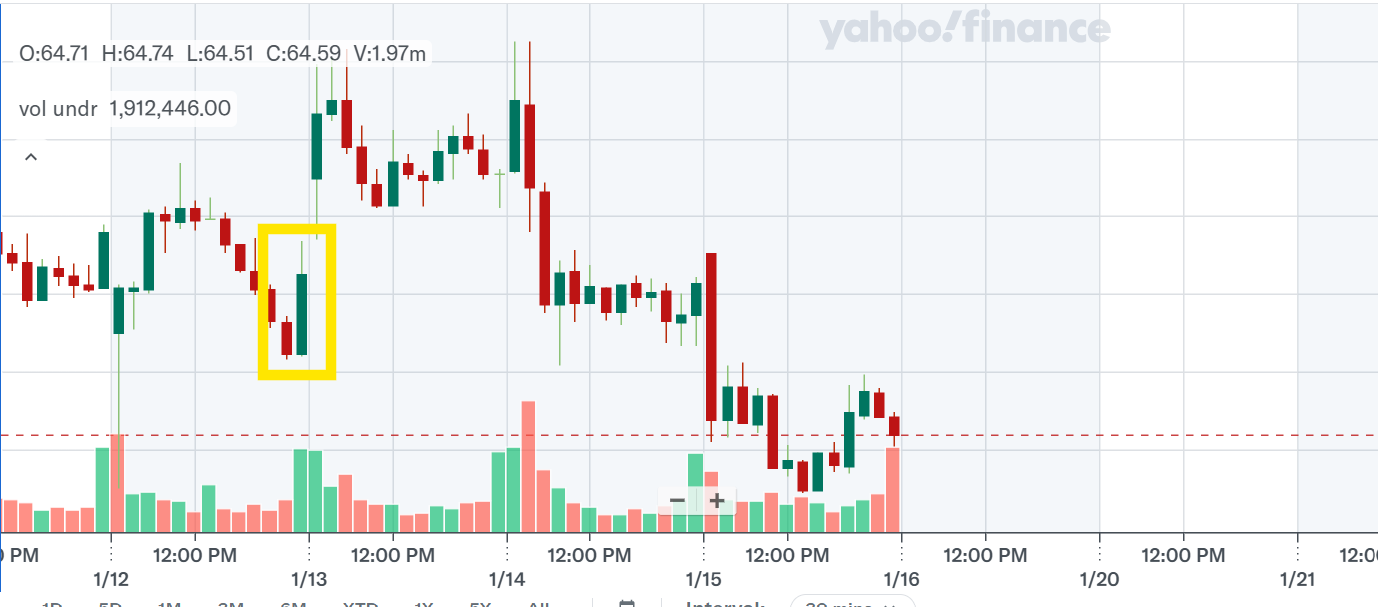
As shown above, on January 13 we experienced a bullish inside bar. We see that the mother triggered the entry for buyers; surely we jumped from ~$65 - $70. However, it was short-lived, but we're seeing the setups at play and utilizing it real time.
Pin Bar Setup
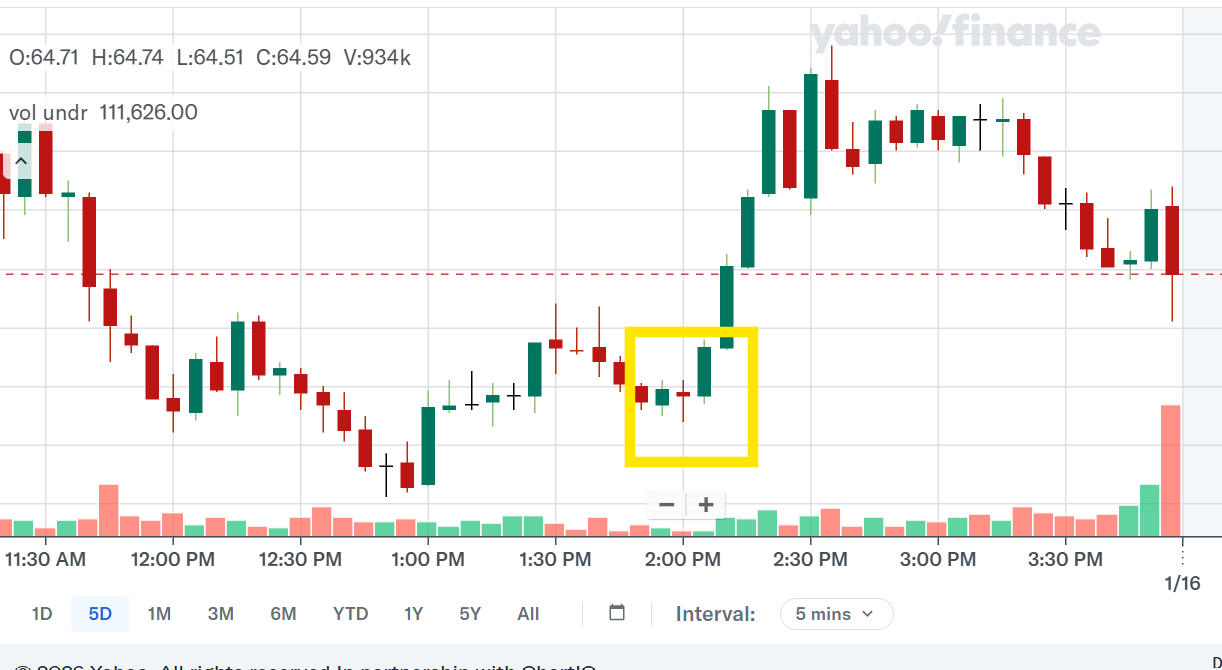
We've established that we're at support level, so we don't expect the price to drop more, quite the opposite. In the picture above, we see the bullish pin bar where a slight downtrend reversed. If we rely on today's performance, we can determine that there is chance for a bullish momentum and expect the buyer to drive the price up tomorrow January 16, 2026.
Final Thoughts
I think today was a bit rough to see the price of $NKE, my share lost the profit I had originally made with the initial contract of $63. Although I feel okay because it's been helping me learn real time. I still have one week left with the call $66 contract. I am not blindly optimistic, I've looked at the charts, the RSI and MACD and the price action candlestick setups and can confidently say I expect a reversal from what we saw today.
I will monitor tomorrow's price, and see if I'm right on the support, for all I know it may fluctuate a little but don't expect it to go below $64 at all. Let's continue to apply what we know and see my journey through, it's exciting learning and applying lessons in real time.
Member discussion