Observations During Correction and Ratios
Okay, it must go without saying. The market is in a correction state, it might be in a correction period for a few months. I've never experienced this, and many traders today may have not either.
I didn't write yesterday because I didn't believe I had something to share, didn't really learn much about ratios as I struggled finding it, but I'll do that today later on. At the same time, I wasn't entirely sure on what the sentiment of the market would be like today, there were so many news happening on Sunday that I felt like it would be a red day for the most part. To my surprise, it wasn't all too bad, but it was still a shaky day for the most part from I've seen for some stocks.
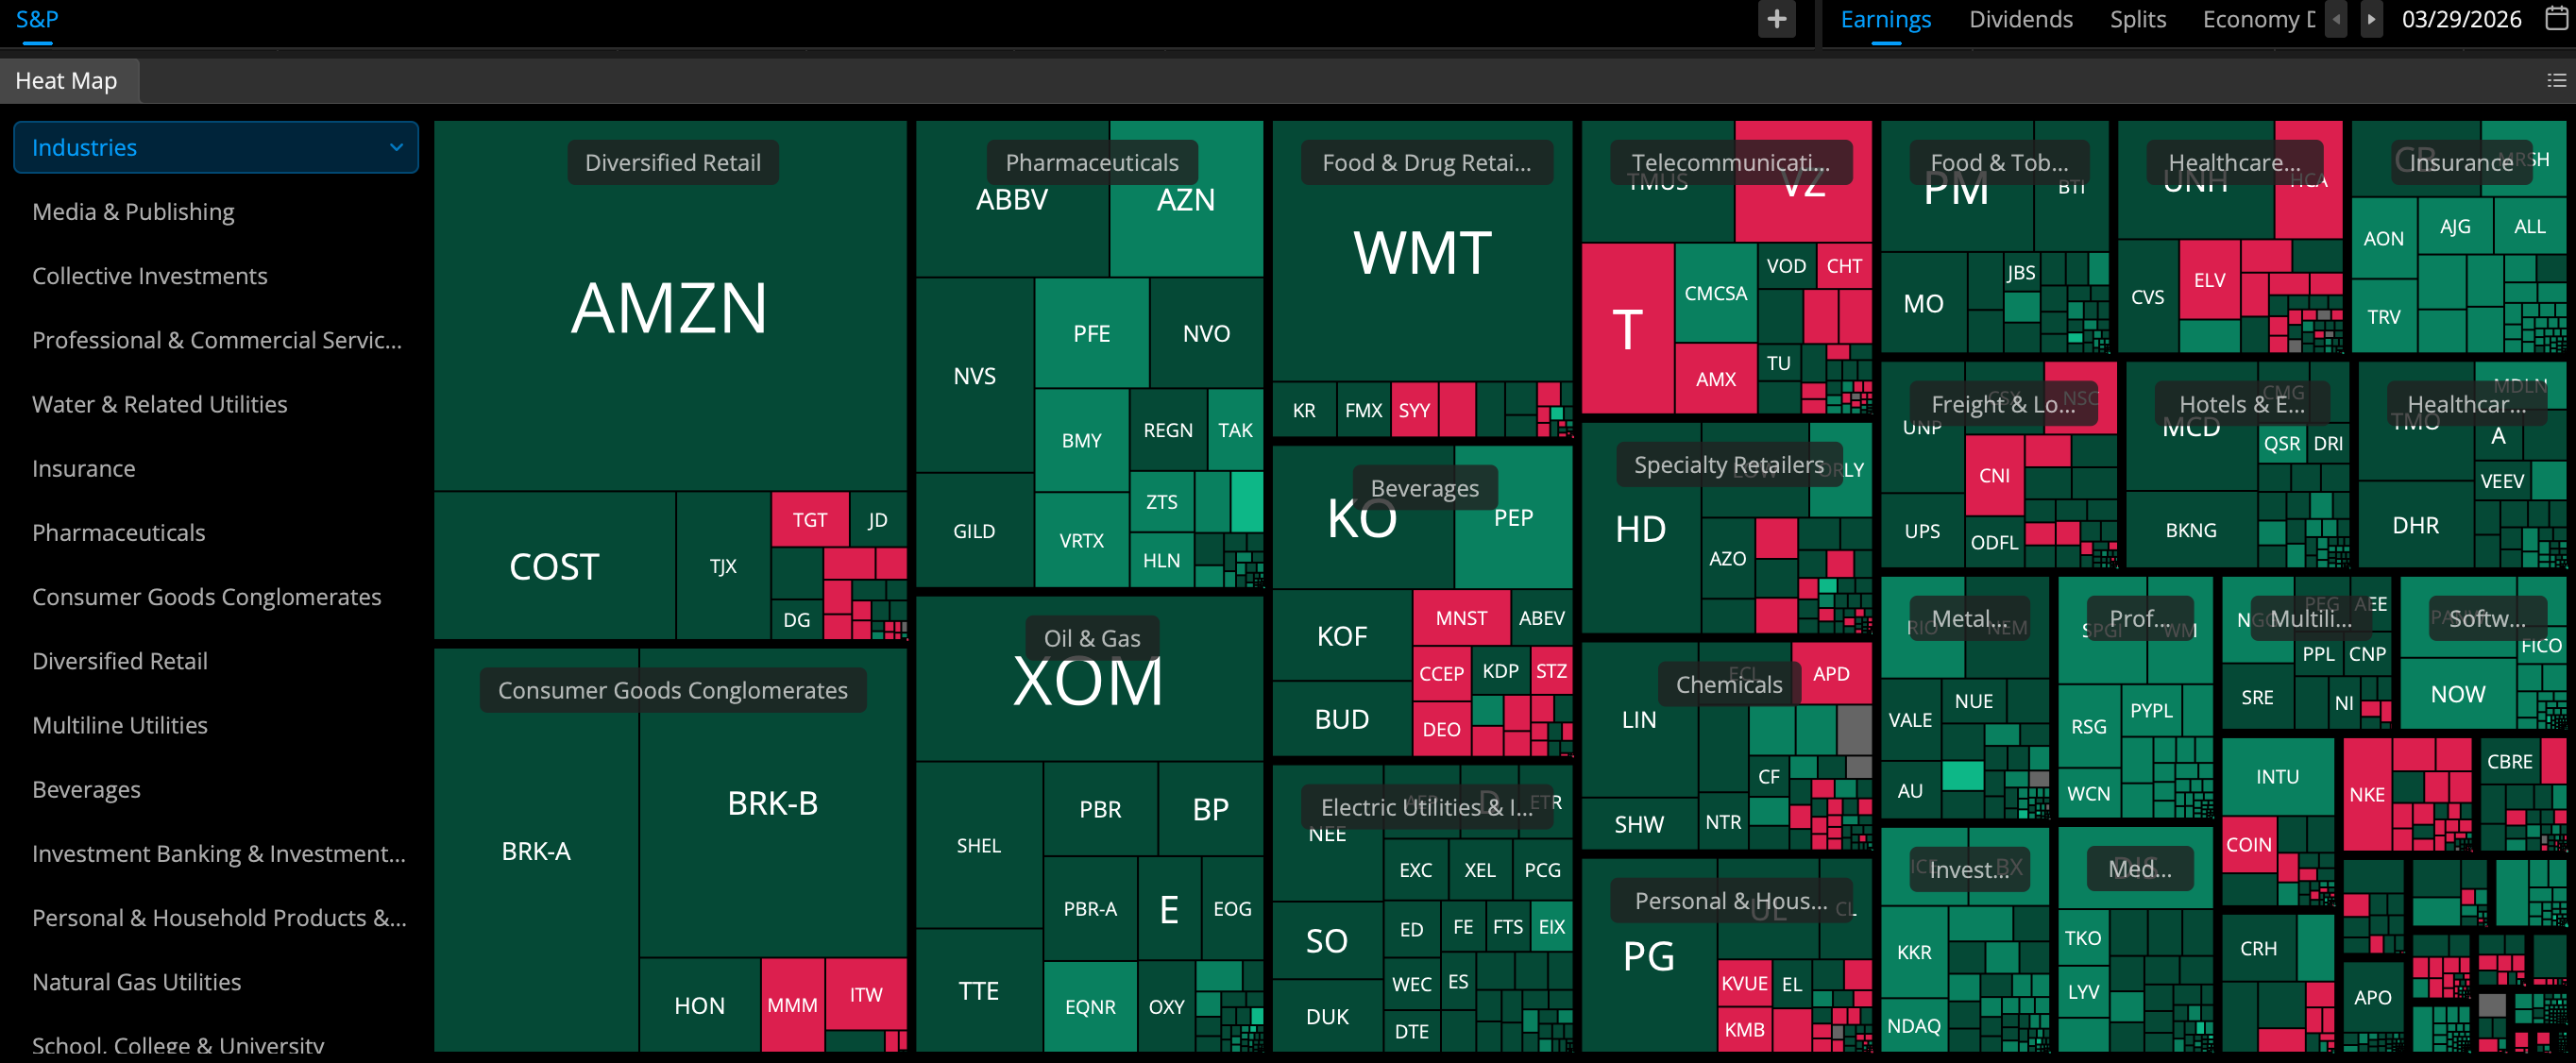
Below is an overview of today's S&Ps performance, it appears that it was a bit overpowered by the green and that isn't terrible. Is it a fake-out? maybe, maybe not. Most of the stocks I've observed closed slightly above their opening price, which then makes the below make sense.
Moving on.
I've touched on how to identified the sentiment of the market, which can be via VIX on my last post. Where we've identified that if VIX is above 25, then it means a fearful state for the market, which means more red AKA more puts. On the other hand, if it's below 15 it is bullish, and therefore more calls.
Now, I also mentioned how to identify the ratios on puts vs calls. In order to identify this, I'm using my thinkorswim account as it is easier in my opinion. In this example, I will be looking at Delta (DAL)
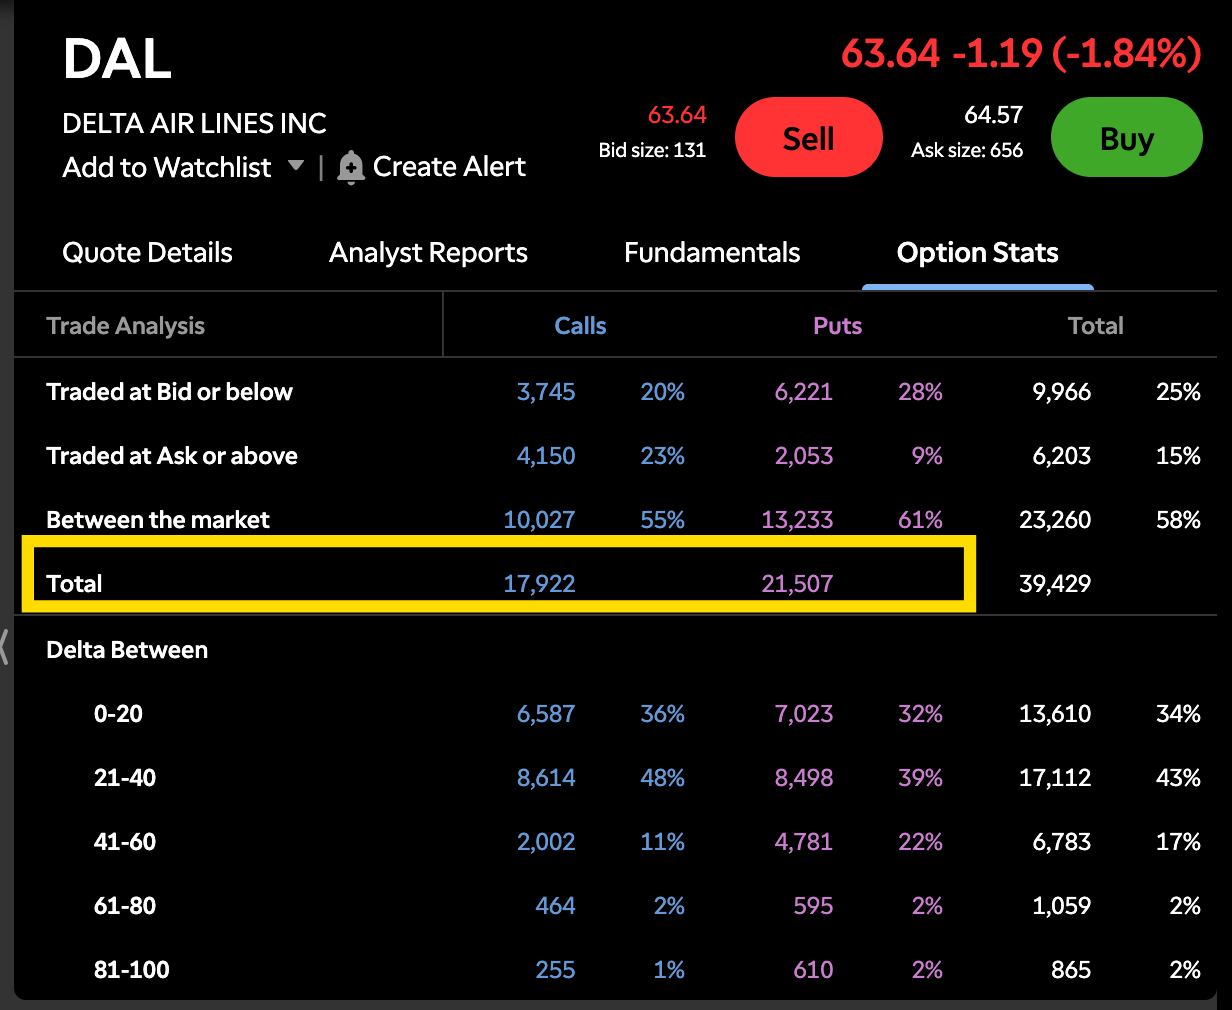
In the above, we can see how many calls and how many puts there are. We then calculate the ratio for this so that Puts/Calls = 21,507/17,922 = 1.20
- Ratio > 1.0: Team Put is winning. (More Puts than Calls).
- Ratio < 1.0: Team Call is winning. (More Calls than Puts).
- Ratio = 1.0: It’s a Tie. (Equal number of Puts and Calls).
Based on the calculation above, we can establish that there are more puts than calls. At the same time, we can look at today's VIX score:
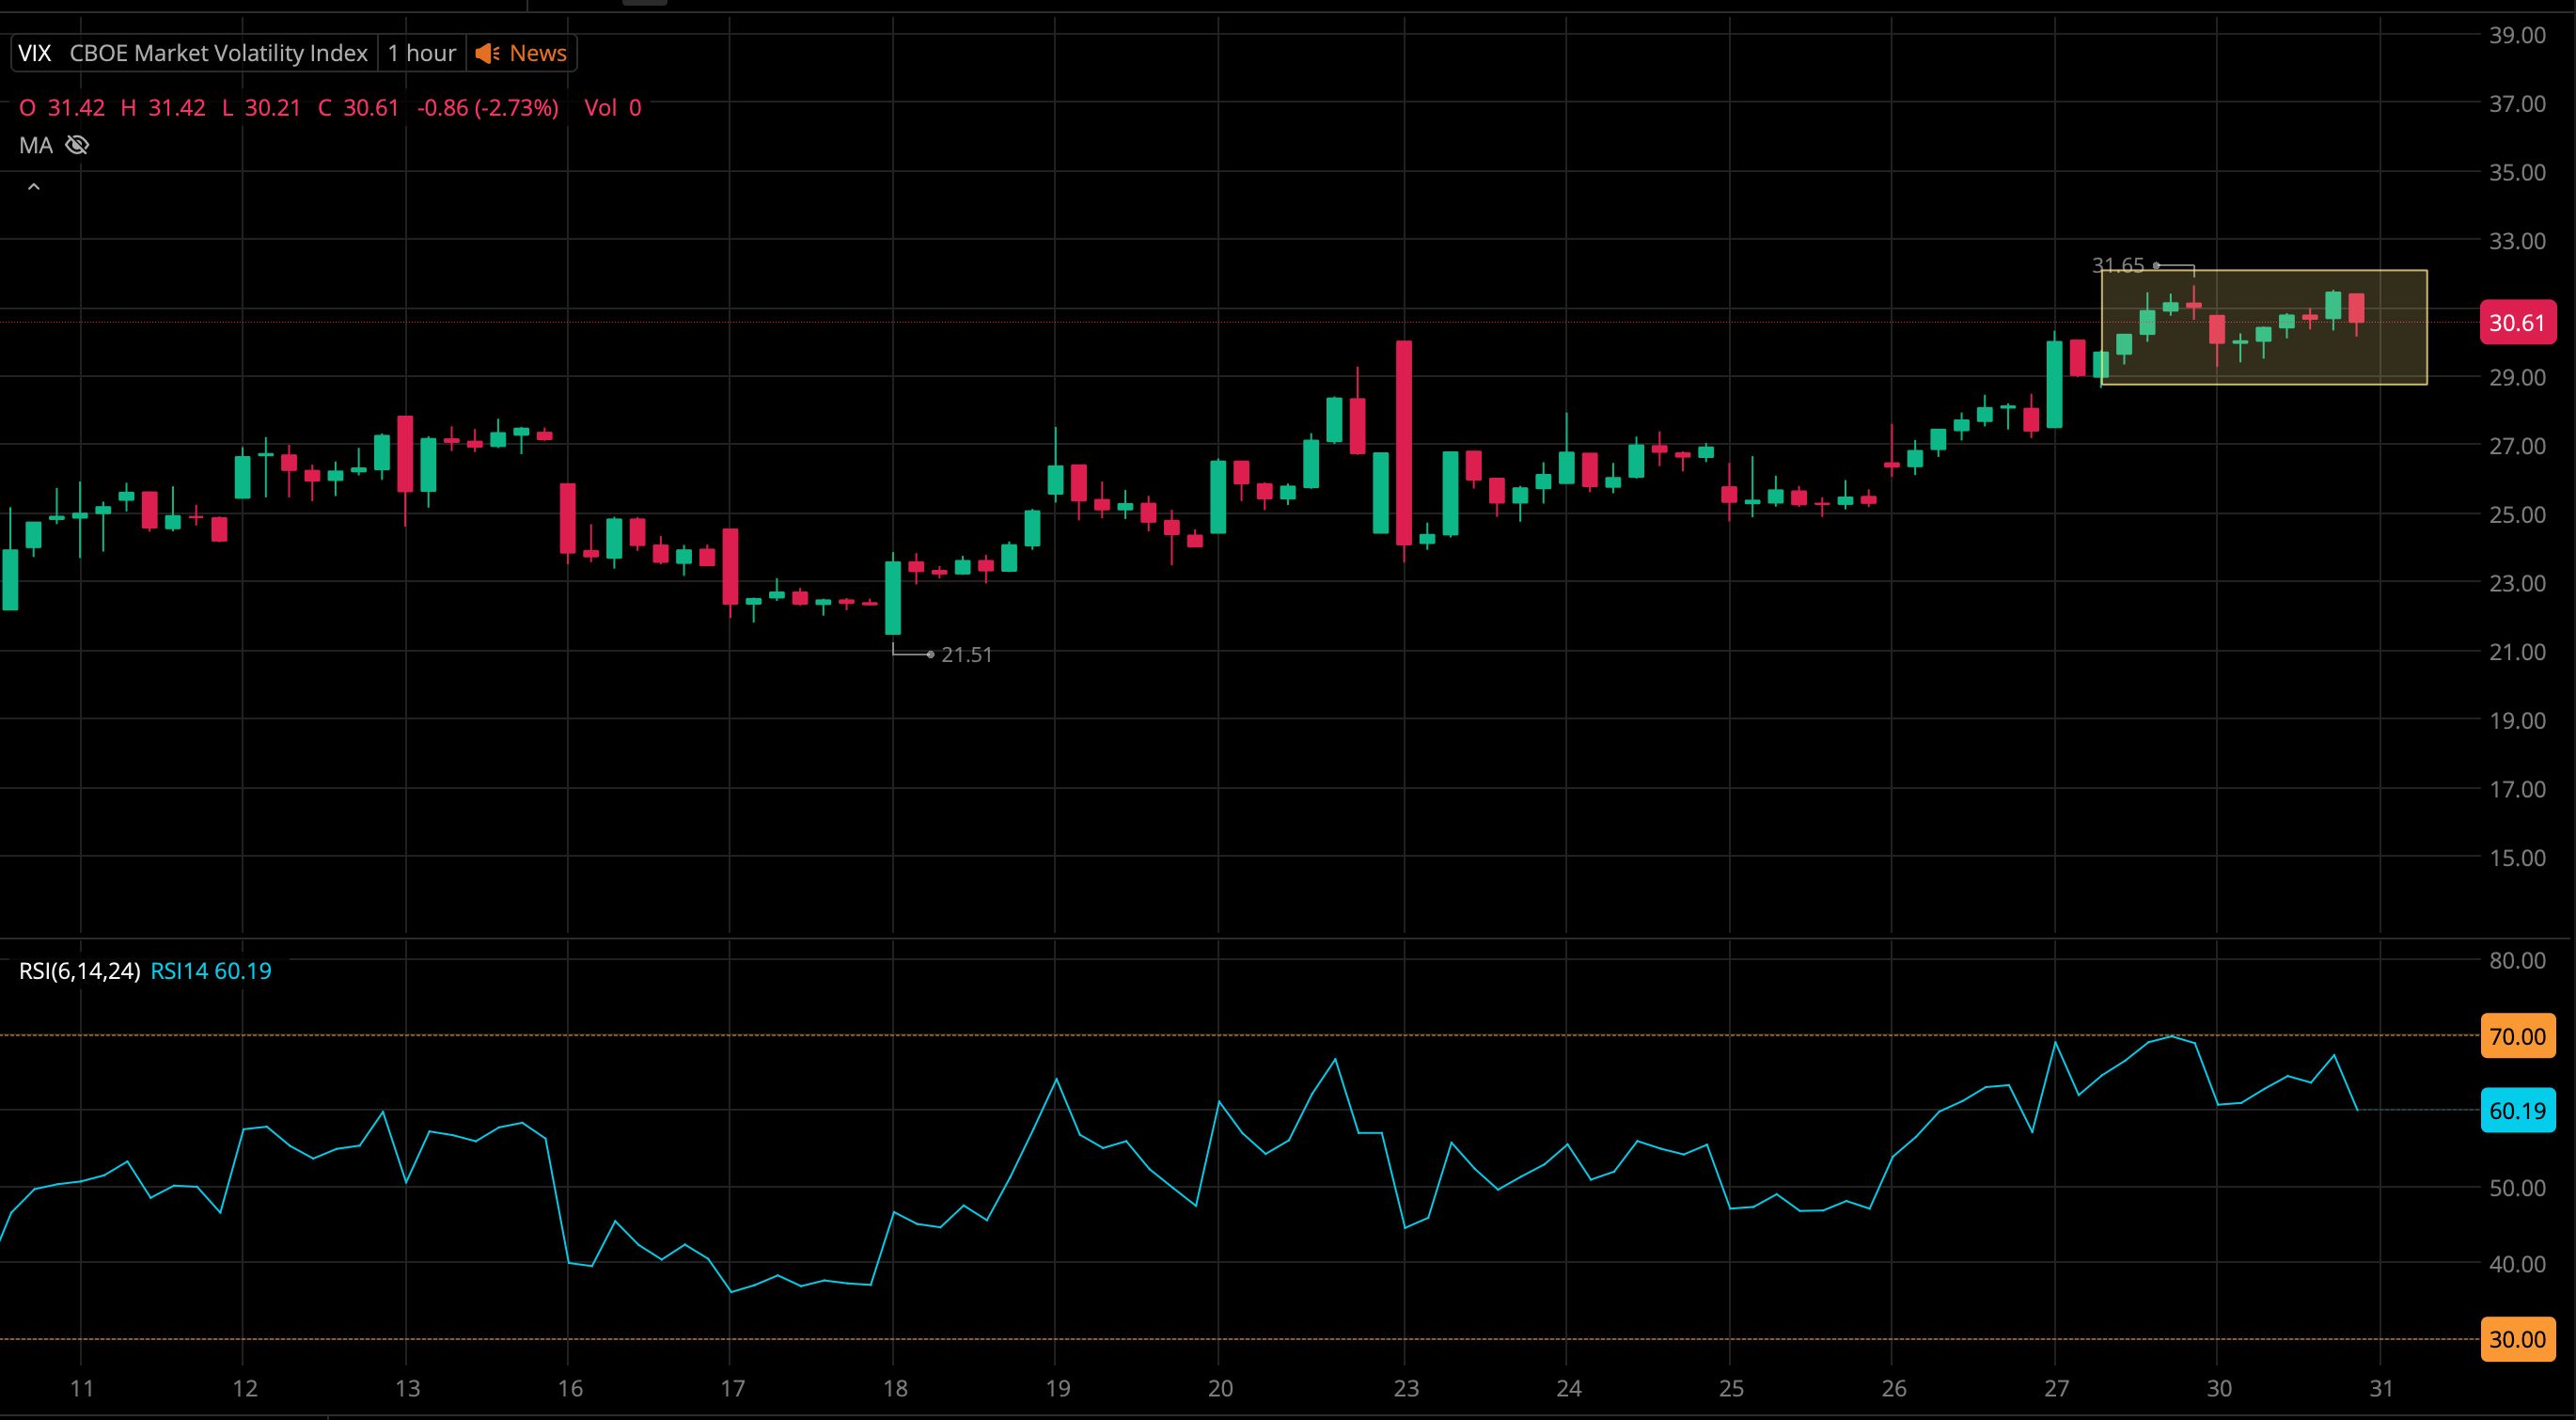
In the above, we can see that VIX is above 30, so it is still in a fearful state. While I'm not entirely sure that the RSI is much use here, we can take the risk and monitor over the next few days. If we were to follow the RSI, we could assume that VIX might cool down a little and go back to a 25-30 range.
Let's now look at Citigroup (C)
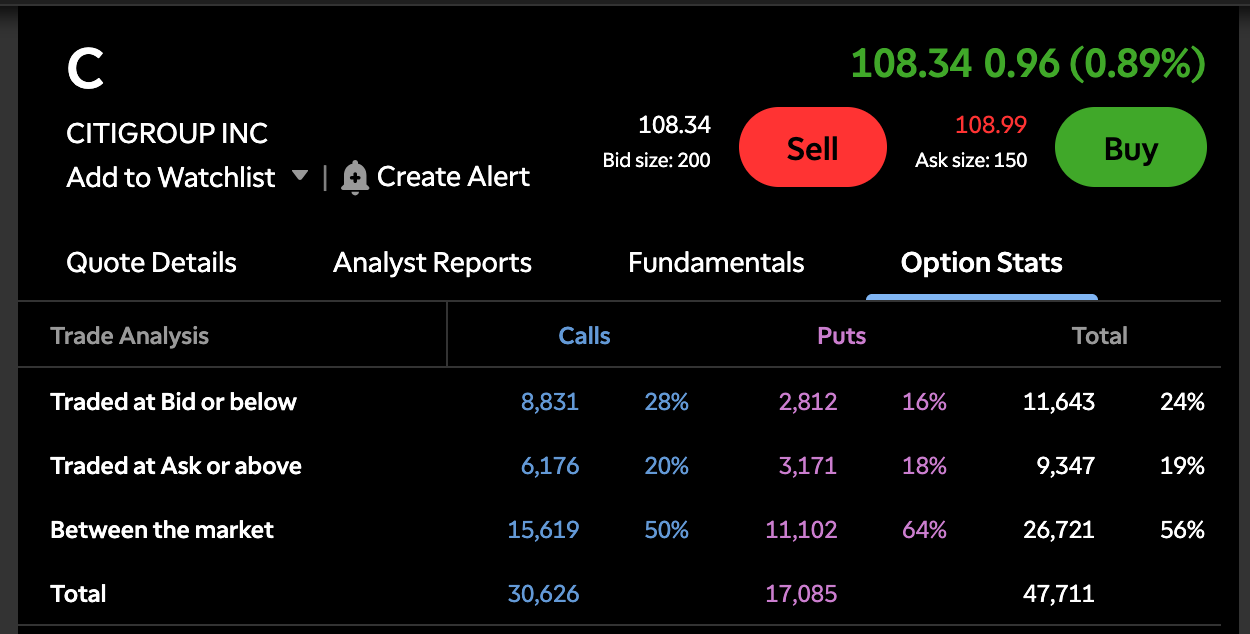
Based on the above, it is obvious that there are more calls, but the ratio is so low 0.56, which may mean that there are heavy convictions on the price going up.
Let's first look at what a put for DAL would look like:
Selling a put for $66 expiring on May 1 would cost $5.35 per contract. In this case, if the price stays above $66 I am on a winning stance, and make profit if it goes above the strike price. If it remains above the break-even but below the strike, then I buy the stock at a slight discount.
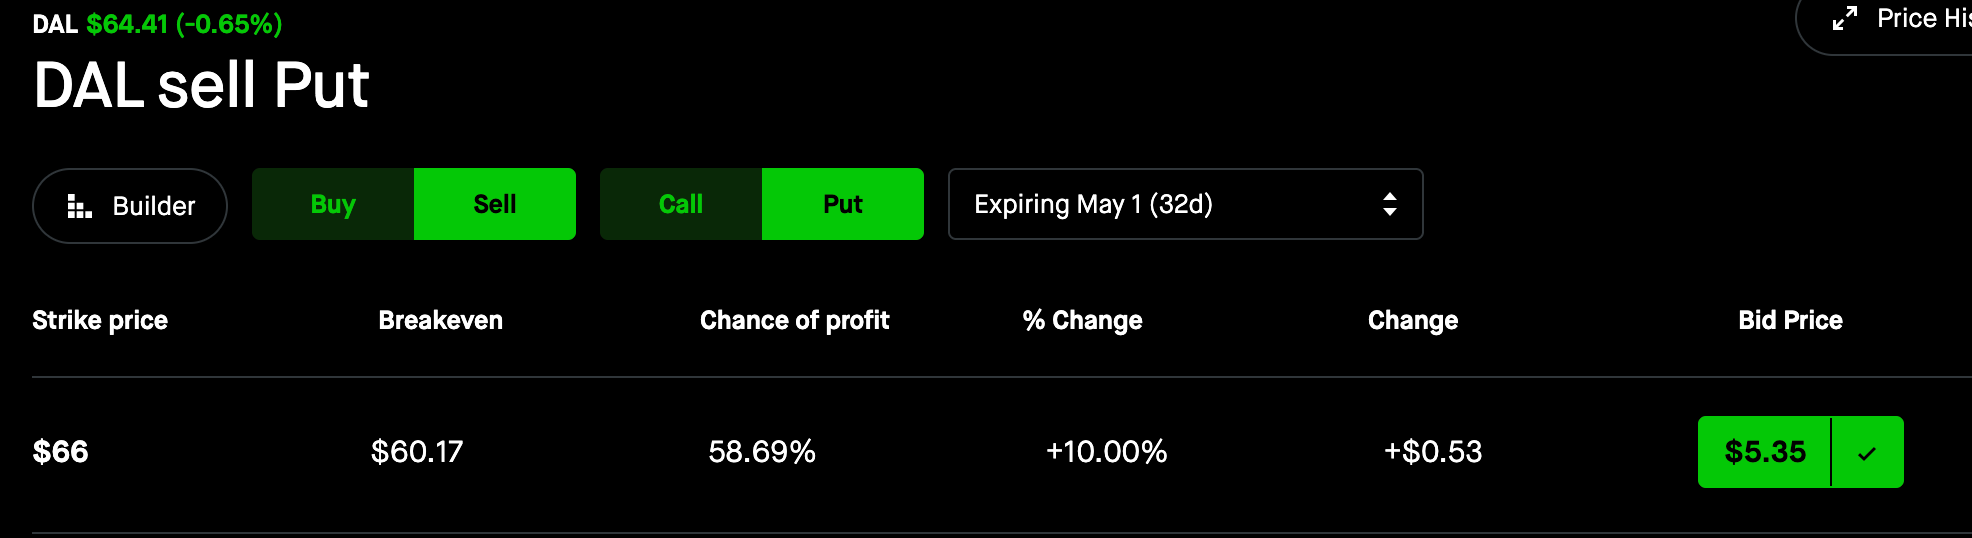
On the other hand, if I were to buy a put, it is more risky since the contract can be out of the money if the price is outside of the break-even. So, a sell put contract for $61 expiring on May 1 is $3.75 but the break-even is $57.87, which means that real profit doesn't start until the break-even is reached. If course, we can always walk with partial profit like we did in the past for SRE.
Let's go back to Citigroup now with a call since the ratio is 0.56 implying strong bullish:
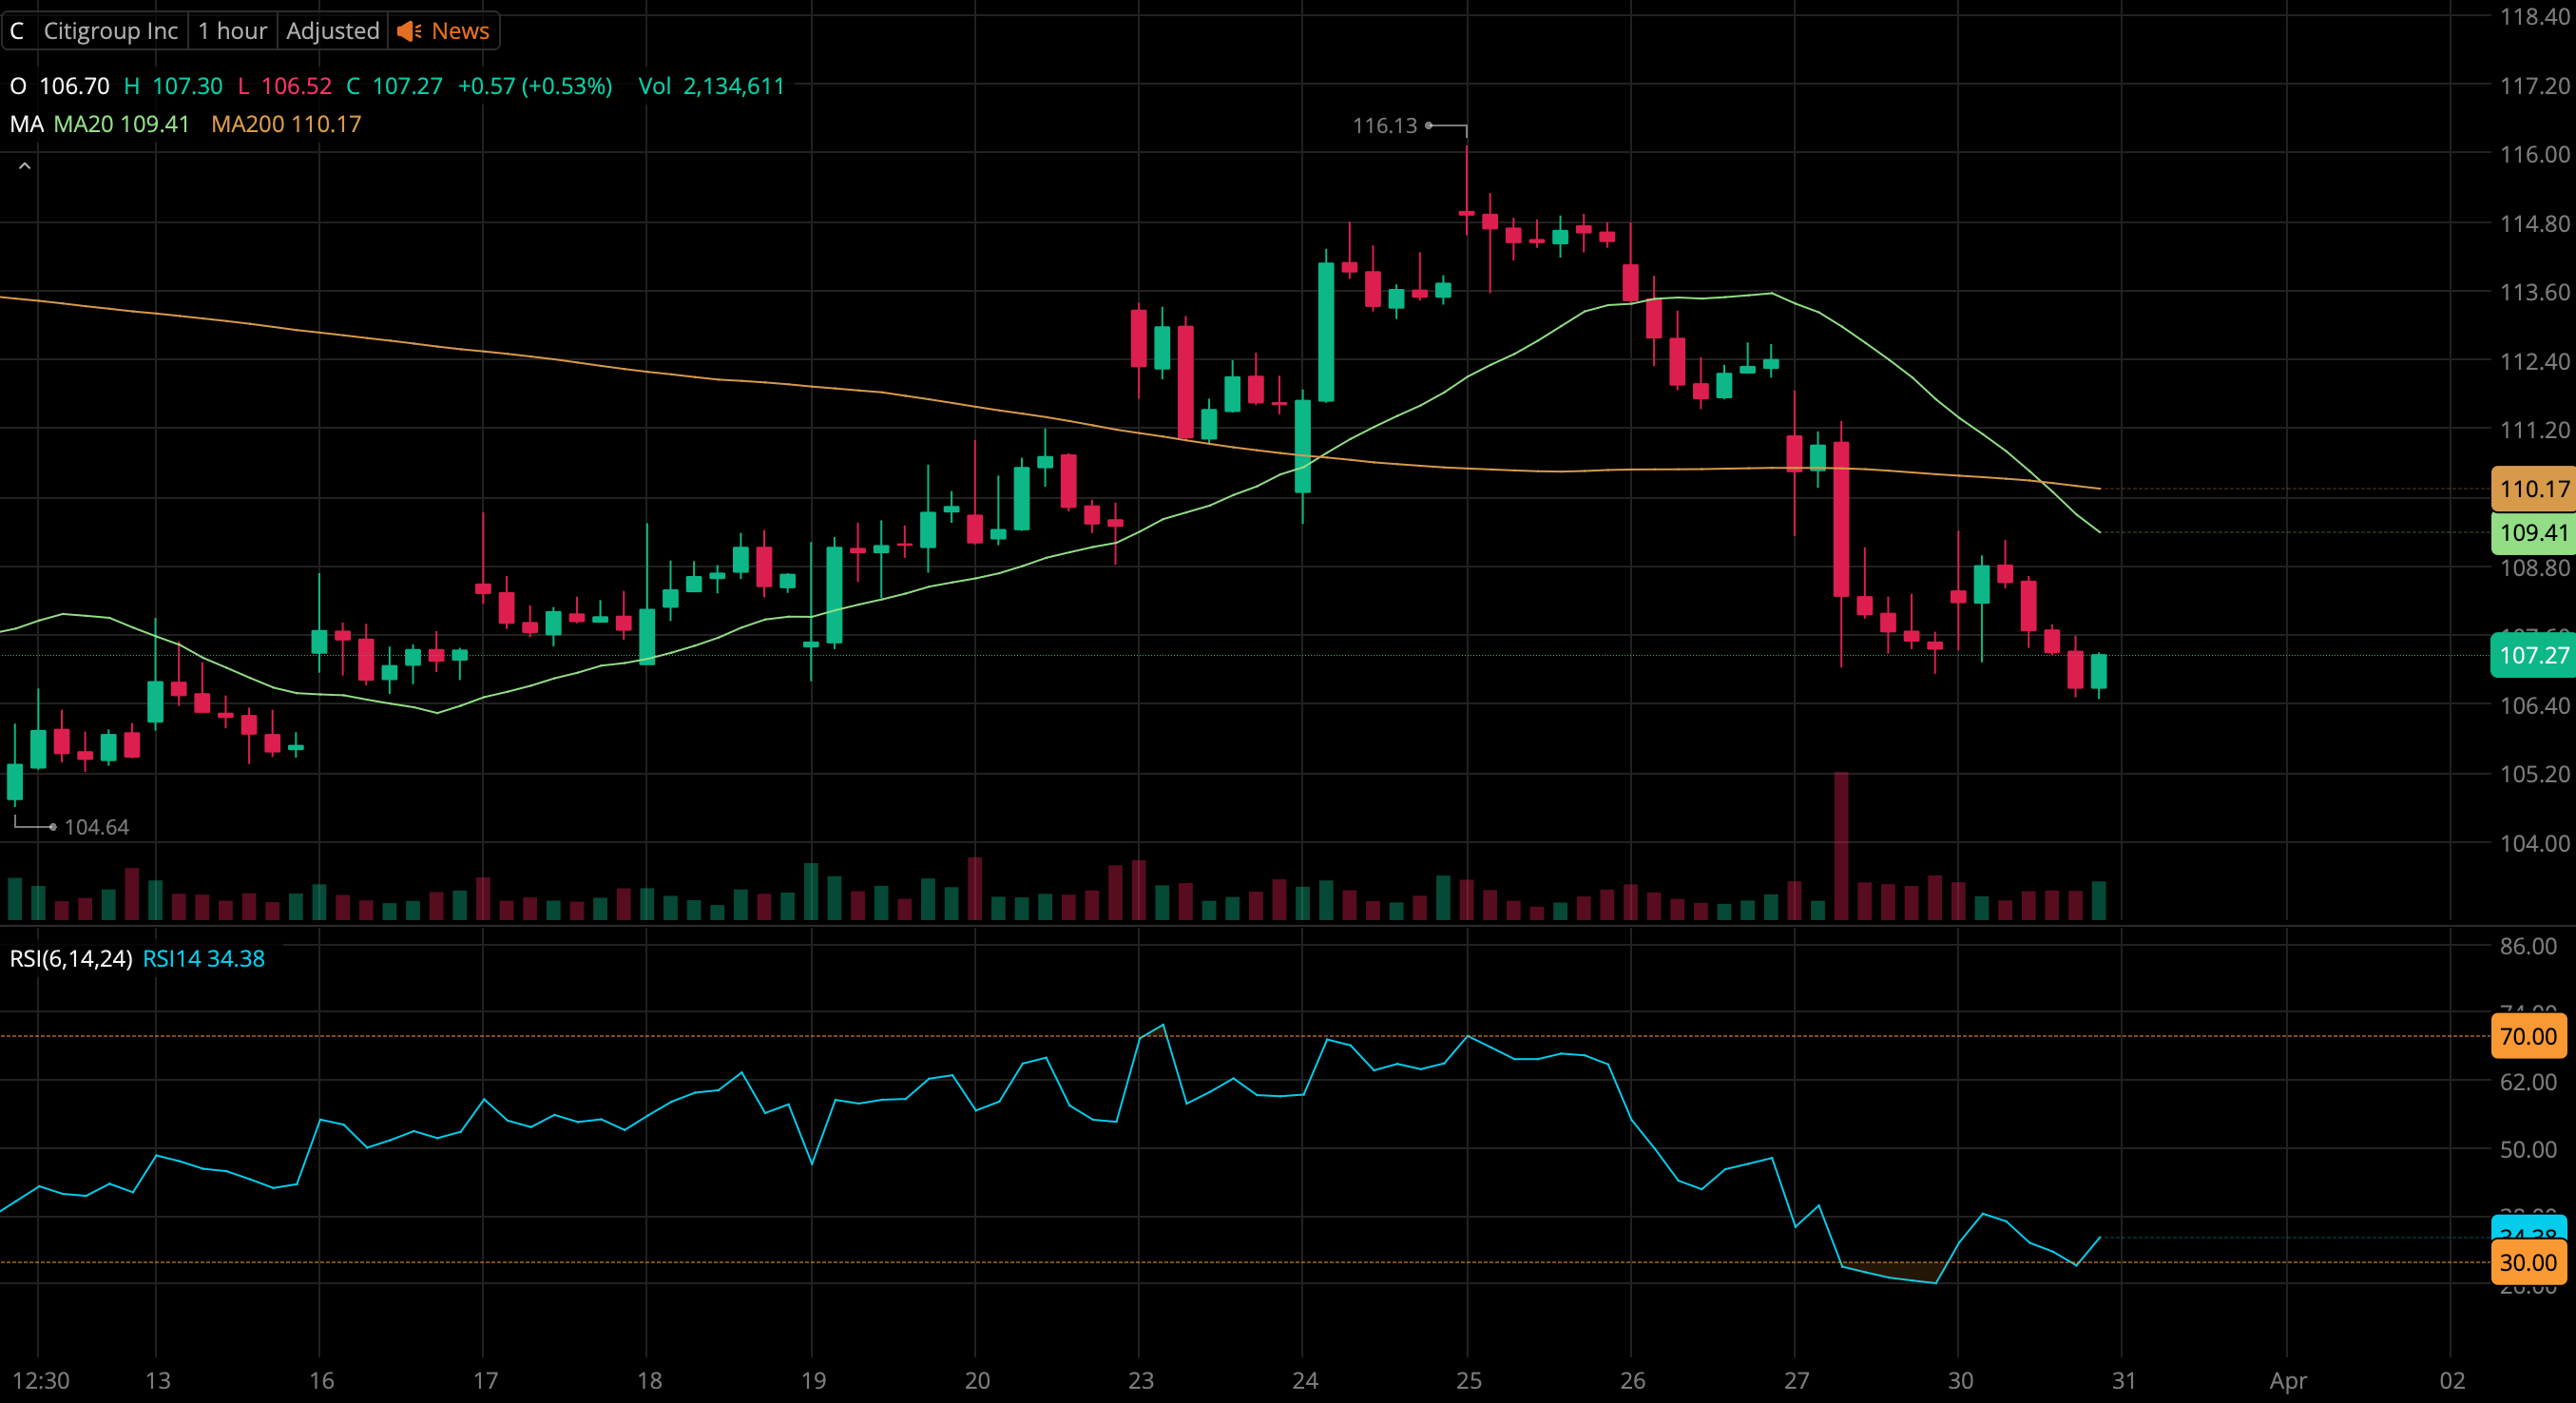
So while the price is still below the 20MA - we can see the RSI starting to recover as well, plus the ratio is below 0.70 which means strong bullish. I am willing to go in tomorrow to test this as well as a put on DAL.
I'll monitor tomorrow's DAL and C post the first 45-60 mins and decide whether it is a good entry for both.
I'm excited to try this, and give it a shot with the VIX, RSI, MA and now ratio. This market is shaky, you don't know what to expect, but it is why I'm trying different approaches, I don't believe this is the general state of the market. It just happens that I jumped into the wild waters of a correction period and a war. Interesting times to learn. We'll see what tomorrow brings.
Member discussion