Previous Wins Analysis
I've mentioned in previous posts that I've always been drawn to the stock market. I simply never knew where to start, how to start, or how to even read charts. Either way, last year 2025, I started dipping my toes in options trading, except I did it with zero knowledge. During the time I dabbled in options, I won, and lost it all back since I had no idea what I was doing. Since I want to become profitable in the near future, I want to master the stock market or at least tame it. For me to do this, I need to learn from my past experiences.
Let's start with $DAL
I opened a call option trade on July 7, 2025 for $DAL @ $52.50, at the time I bought the contract for $1.80 when the price was $49.29. I sold this contract on July 10 when $DAL reached $57, at this point I made profit from it since the contract was for sold for $3.10. Now, this contract only took 3 days to be a winner, which is great if we think about theta, I didn't pay much "rent" in those three days. Let's look at the chart below with an emphasis on June 25 - July 10:
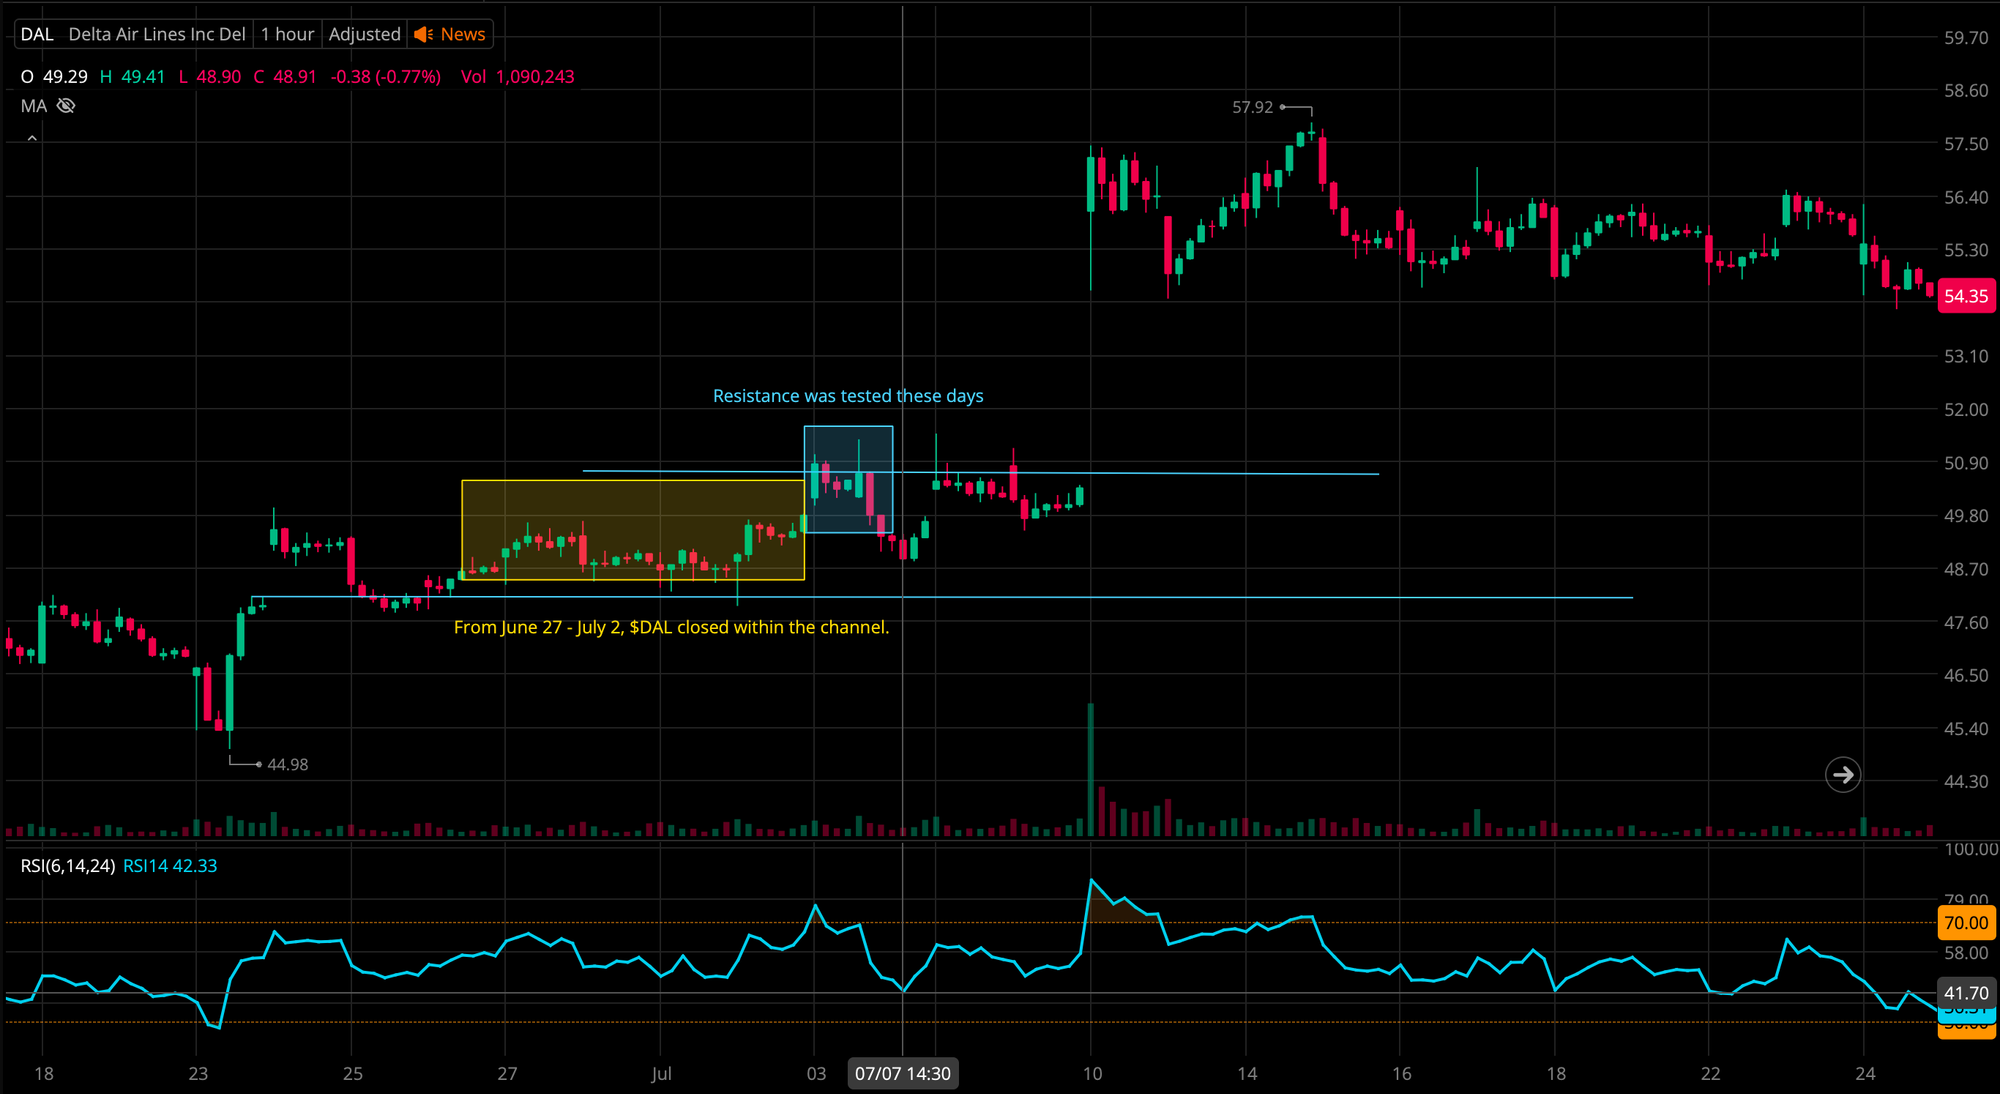
In the above, I have highlighted the define channel, the support of ~$48.20 was tested around June 26, but from June 27 - July 2, we can see that $DAL closed within the channel creating a stable stock price. Resistance was then tested after July 3, and I bought my contract on July 7, after the resistance was tested. At this time, $DAL closed within the original channel, and the volume on this day was 1M. I've added RSI to the chart, on July 7, we can see that RSI was dancing around the 40 mark, while RSI crossed 70 when resistance was first tested on July 3, it wasn't as aggressive. Let's stick with June 25 - July 7, the RSI seems steady. Buying on July 7 was a great investment because:
- Bought within the defined channel.
- RSI observed for 10 days was a steady machine.
- Bought right before the buying frenzy it occurred on July 10, when I sold it.
Something I want to pay attention and look for is RSI when support was tested. It might be meaningful that even though the support line was crossed, the RSI remained steady. This to me indicates neutrality among the traders.
Key observation: when the support was tested, the RSI remained in the higher bounds.
Let's move on to $NKE
I bought a contract on December 24, for $63 to expire on January 23. I bought this contract for $0.88 and sold it on January 5 for $2.50 when $NKE reached a price of $65.35.
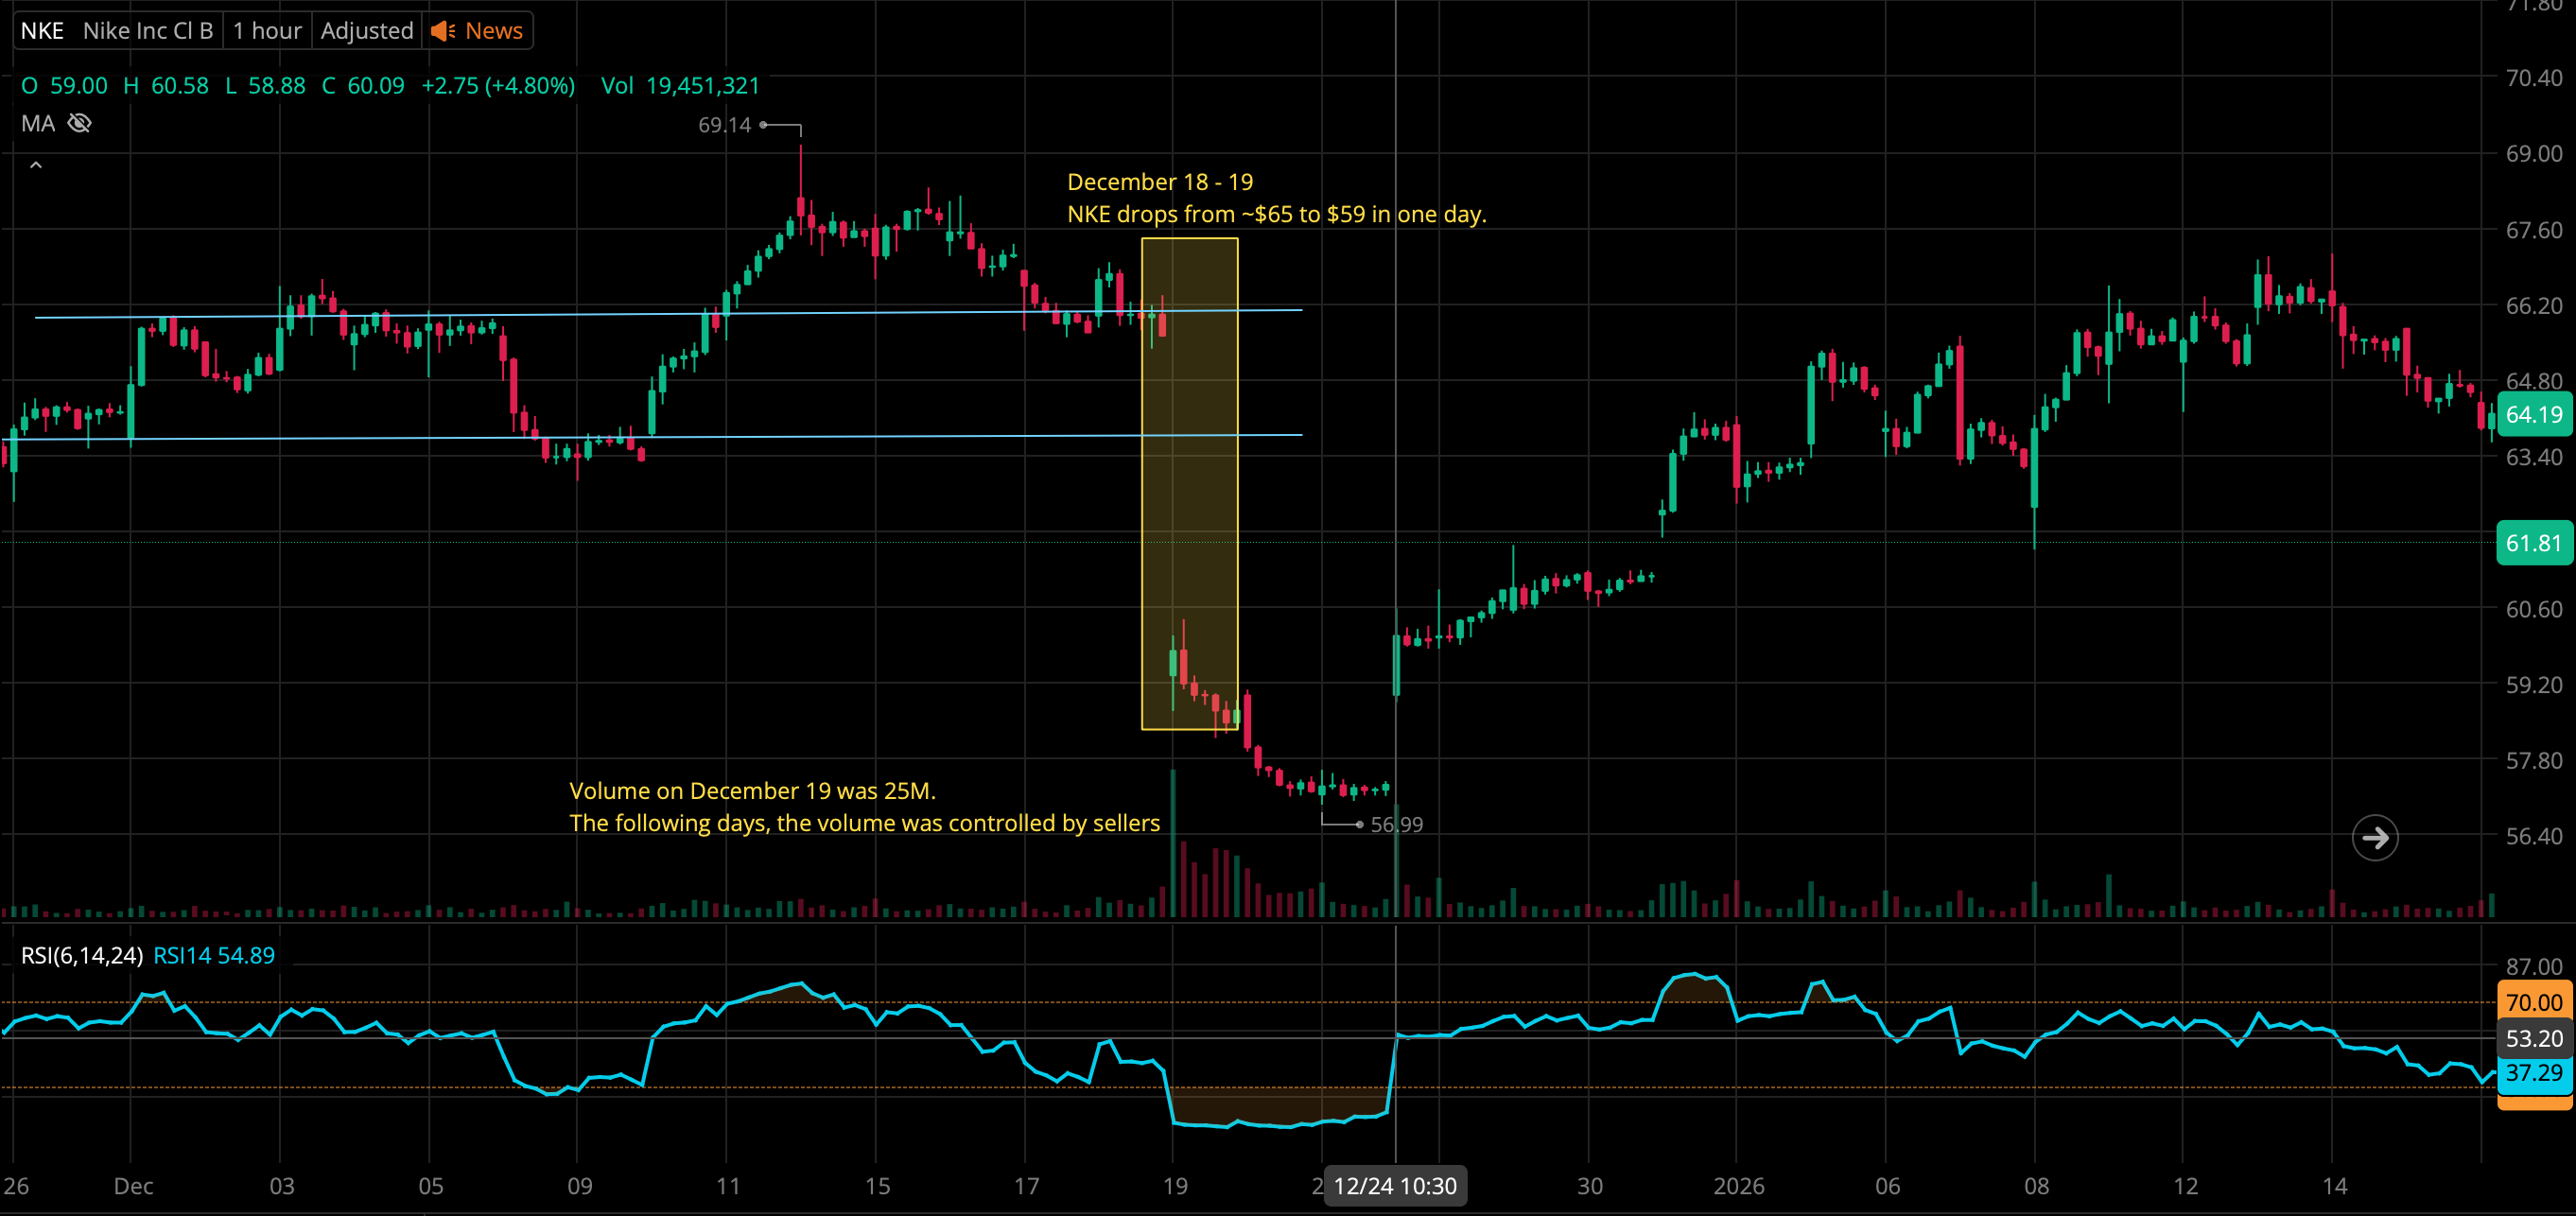
NKE was an interesting one. From the end of November 2025 we observed a channel with horizontal support of ~$63 and resistance of ~$66.20. There's a lot to cover with NKE here. See the points and chart below:
- From Decembet 11 - December 17, we can see a breakout in the resistance, we see a new high of $69, but it didn't hold. The trading volume seems low in these days, but the RSI was rather high so it had to go down.
- I've highlighted the significant drop from December 18 - December 19, a $6 change in one day. This is when there was an earnings call, where the earnings per share exceeded expectations, but the sales in China (biggest market for NKE) dropped by 17%
- The RSI was in oversold from December 19 - December 23. Around this time Tim Cook and NKE's CEO stepped in to save the stock by investing in it.
- I bought the contract on December 24, where the price sat at $60 and the volume in one hour was 19M, but the price remained steady for several days
Key Observation: the support tested around December 9-11 possessed a high RSI, from this moment on we see a spike in price from $63 - $69 in a matter of about 5 days
Let's zoom in a bit to the moment I took profit. Again, I sold this contract on January 5, where the price close at $65 so I crossed my break-even and took profit. Looking back, I think I took the profit without second thought. At this point I had already started this journey of learning but hadn't gotten into all the technicals. I hadn't set up stop losses or any of that, so looking at the chart, one may say that I could've maximized my wins if I sold around January 15 when the price hit $67. And to be quite honest, I did feel some FOMO in that moment.
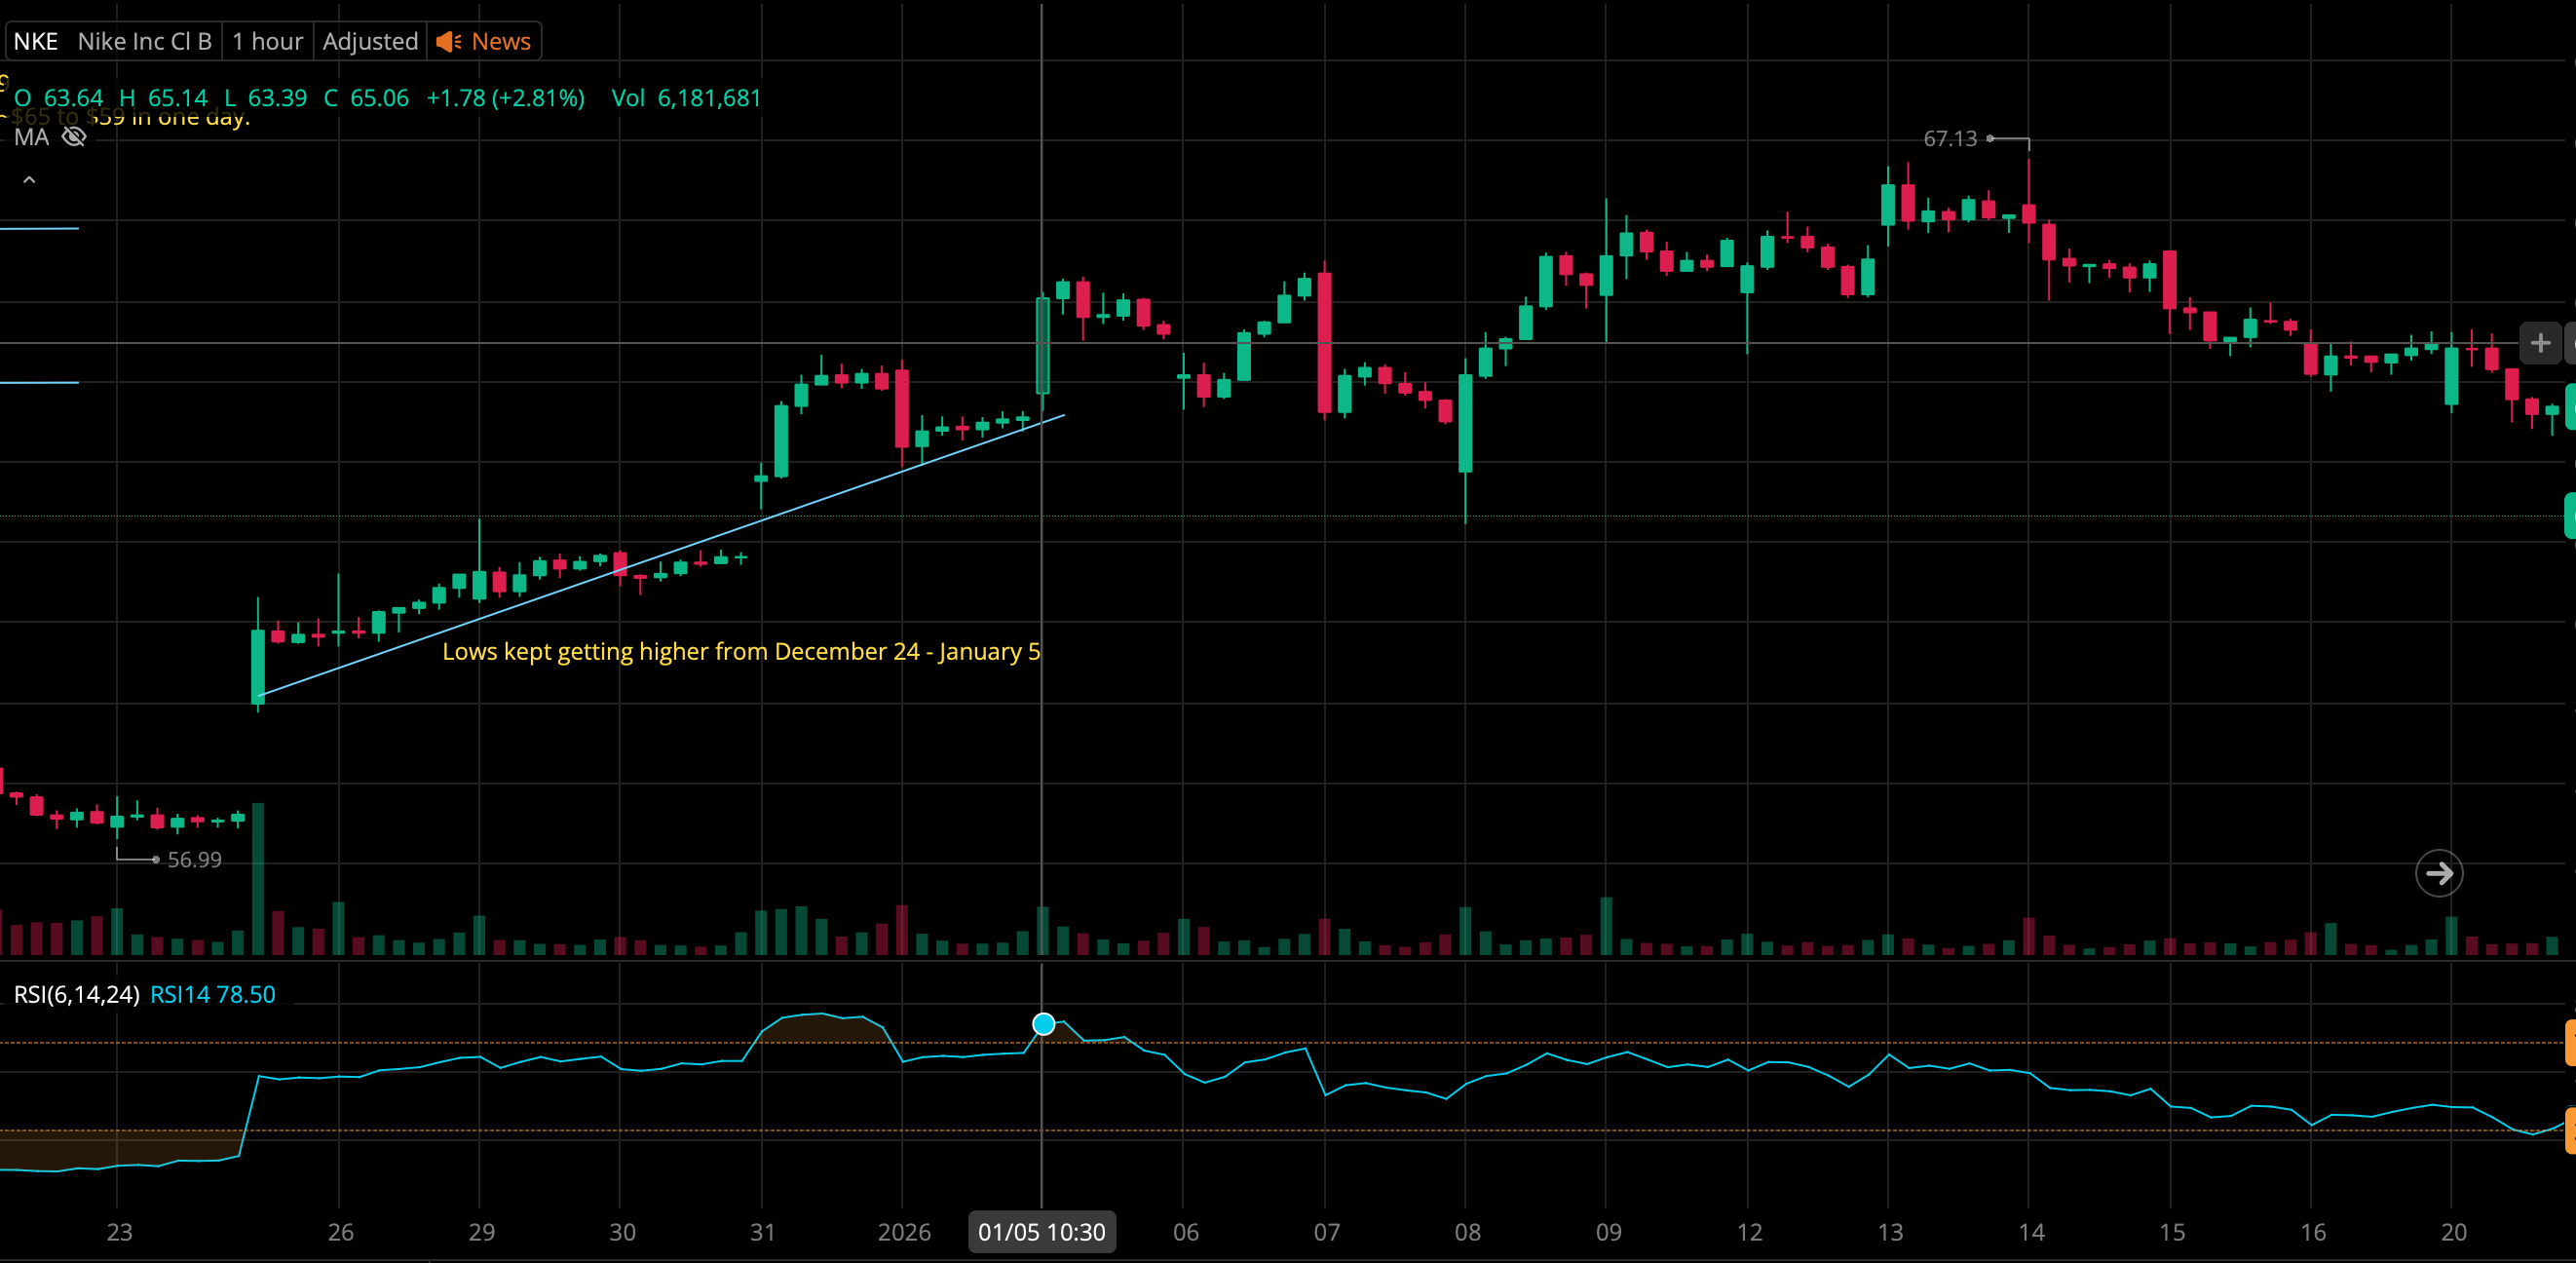
Based on the chart above I want to call out the following:
- The lows kept getting higher from December 24 - January 5. I know I haven't covered diagonals in details, but this meant that NKE was on a postivie trend, the price was bound to keep climbing up
- The RSI danced a little around the 60-70 mark, which looking at it now,it would have made me a bit nervous then expecting it to go down.Even when it did, the price remained in a steady range.
- A new channel was define from January 5 onwards.This is where I took that revenge trade, which we will cover on the losses post.
- I find it interesting that on January 5 the trading volume was only 5M, a significant number yes, but there wasn't much conviction around it.
Final thoughts on this wins analysis
So I definitely will be using RSI, Channels, and Volume when entering trades. The two trades above have proven that they are reliable. I think a bit of the challenge will be seeing it in real time. It's a bit easier to understand it retroactively when there's enough data.
At this very moment my gem is around support breakout while RSI is 50+, this to me indicates positive feelings around the stock. I've seen it twice above, where after this is observed, the price either goes up or remains within a set range for a while before shooting up (like DAL). As for NKE, seeing this happen before the earnings calls news also confirms it for me. The news definitely changed the course of the stock which caused that $6 change in one day.
I'll be happy to test this theory on my next trade, though I know it will take some time in finding the right stock to buy. I know I mentioned I have a 9-5 job which prevents me from looking at charts all day, but honestly nobody cares. So, I'll look at charts on the time I invest for this outside of work and look for the little gems I have observed and see if they hold value.
Member discussion