Price Action - Pin Bar Setup
Today I’m back with another setup, it will be brief as I am short on time with all the work I have at my job.
I’ve learned that there are different set ups through price action. Some are based on the candle sticks, chart patterns, and trend based patterns. Over the last couple of days we’ve been discussing candle sticks patterns. So, this is the last price section on candles pattern, and we will be looking at the pinbar setup.
First, this pattern is slightly different from the engulfing and inside bar pattern. How? it only looks at one candle as opposed to two. The way we identify this pattern is by understanding the trend as well as the anatomy of a candle sticks.
The three parts of a bar are: shadow, small real body, and opposite short stick.
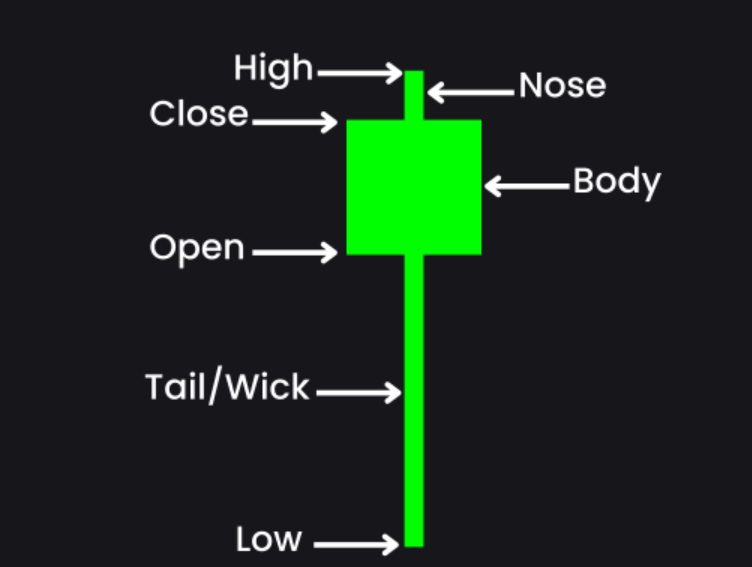
The tail also known as the shadow is the longer stick in each candle, this indicates where the markers tested the bounds of a stock’s price. Typically when the tail is at the bottom after a downtrend, it may indicate a bullish momentum happening.
Second, the body is crucial in the navigation of this pattern. The body shows us where the stock closed in relativity to where it opened during the volume of selling/buying.
Now that we know the parts of a candle stick, we can discuss the bearish and bullish pinbar.
A pinbar is considered bullish if the pinbar has been observed during the downtrend, this is by having a longer lower wick. The opposite is true for a bearish pin bar. The pinbar’s long wick will be at the top of the body. When this pinbar has been observed in a uptrend, and resistance is prominent, we can determine that there will be a reversal and trend will shift down.
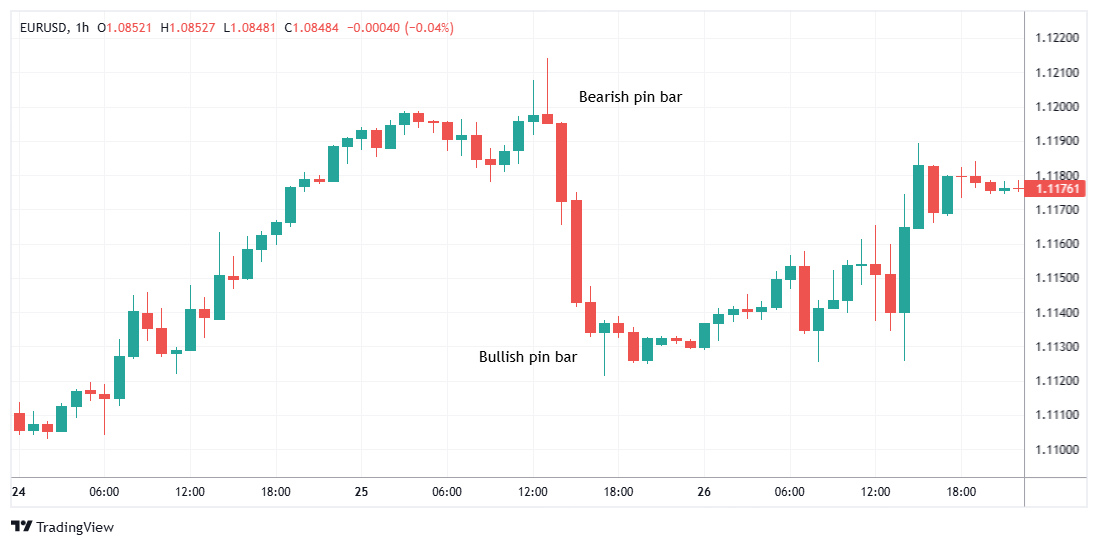
Based on the different sources I've read and the photo above, it is evident that these reversals occur during resistance and support levels during a trend (upward or downward). According to tradeciety, a pinbar setup works best during longer periods of time. For example, one day or weekly chart. So, let’s look at it from the $NKE example for the last 5 days
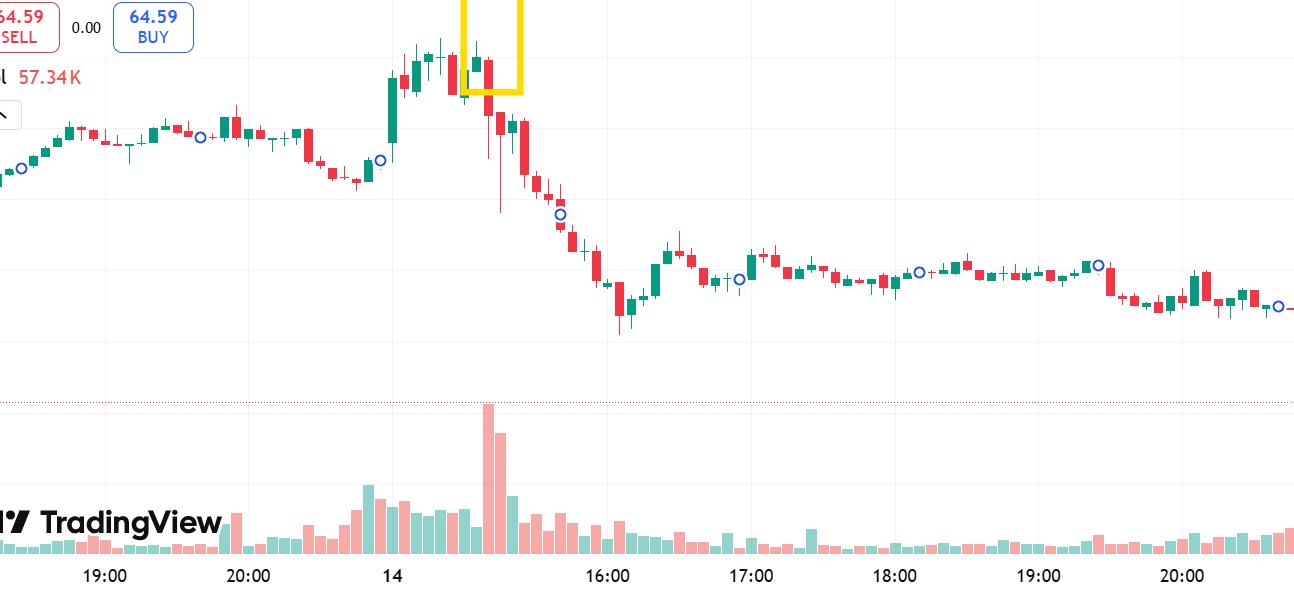
If you zoom in on January 14, you will see a bearish candle after a small uptrend.
Final thoughts
This was short and I was falling asleep writing this because I’m tired, but I’m glad we learned a new setup. I think I’ll use this same one tomorrow to analyze the stock again and try to identify both bearish and bullish
Member discussion