Simple & Exponential Moving Averages
In my last blog post I briefly touched on Simple Moving Average (SMA), this allowed me to create an estimate of what to expect, I calculated the SMA over the course of one month and then 5 days.
In today's learning, I deep dived on exponential moving average (EMA), which is similar to the SMA in the sense that it still calculates the MA over a period of time. The difference then lies on assigning more weight on the most recent price data.
I've read various sources to get a better understanding of how EMA can be utilized. I've gathered that there are both advantages and disadvantages when using EMA. For one, the EMA can determine the current trend; it is more widely used for traders to target an entry or exit point- will be discussing these later. Given that the EMA tracks the price of a stock more closely as opposed to the SMA, EMA can be more suitable for short term trades.
So, let's go back to my current example for Nike to observe this. In the chart below, the period is for one month. Where the yellow line is the SMA and the blue line represents the EMA.
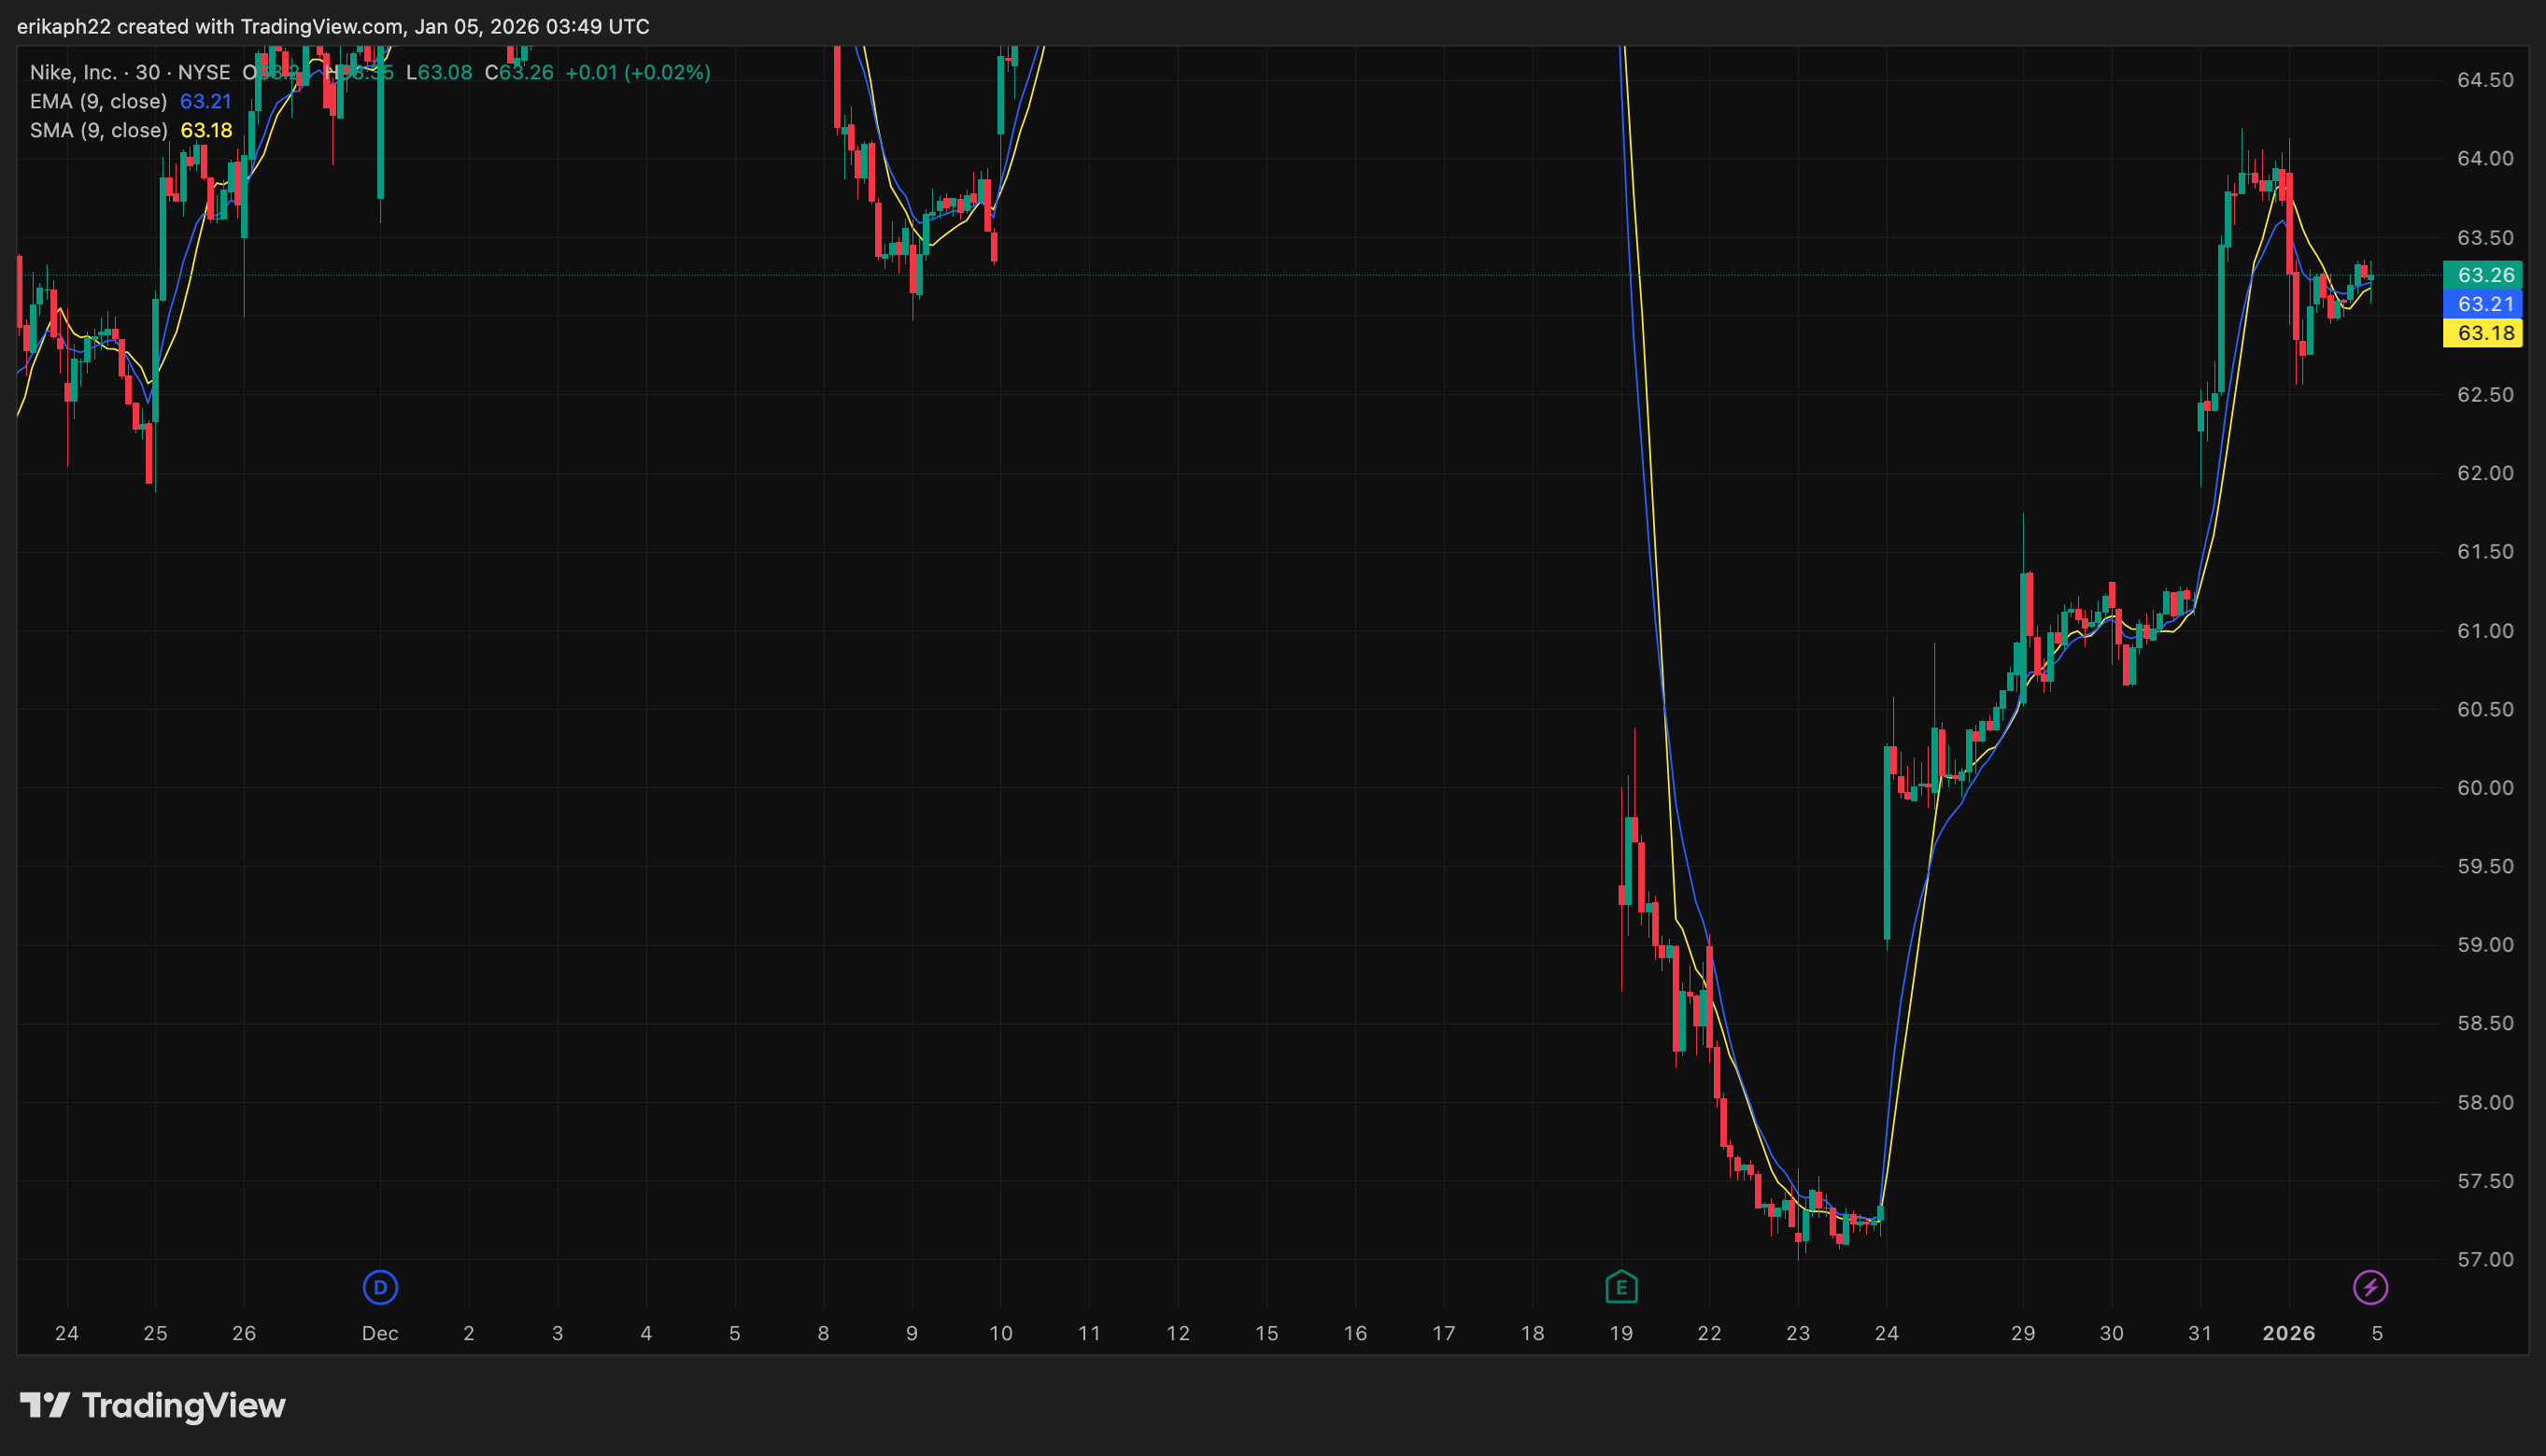
As mentioned, the EMA is closer to the price of the stock. In the chart, $63.26 is representative of the current price so we see that $63.21 (EMA) is closer to current price than SMA $63.18.
Aren't we so lucky to have these tools so that we do not have to manually calculate the EMA and SMA? I think so. Either way, I will talk about its manual calculation for knowledge reinforcement. To calculate the EMA, we will use the following formula: EMA = (Current Price - Previous EMA) x Multiplier + Previous EMA
We will use the SMA (sum of closing price over a period of time divided by the total number of days in that period) as our previous EMA, in this case ~$63.46. Our multiplier is determined by the following formula K = 2/N+1 where N is the number of days we are looking at. Because the stock market is closed on weekends and holidays, our one month look back window is truly 20 days as of January 4, 2026. So, K= 2/20+1 = 0.0952
This leads us to EMA = (63.26 - 63.46) * 0.0952 + 63.46 and once this is calculated we obtain our EMA = ~$63.44 which is a bit higher than the one in the chart, but certainly much closer to our previous EMA (63.46). Yes, I am aware that the numbers are slightly different than the ones in the chart, I used TradeView for it and I need to fully understand how it gets computed on that platform. My numbers on the other hand are based of closing prices from December 4, 2025 - January 4, 2026.
With all of the above in mind, we could use the EMA long term and short term to make a decision on whether to buy or sell a stock (Entry/Exit). An example would be EMA for 30 days and EMA for 60 days. When adding these two lines to a chart, we could expect a cross point between the two. In the chart below, the green line represents the shorter period EMA while the red represents the longer period EMA

As specified, the blue arrows suggests buying, the reason for this being that the shorter period EMA goes above the longer period EMA. Alternatively, the selling is suggested when the shorter EMA goes below the longer EMA.
Final thoughts
I already feel very knowledgeable and I haven't even begun to scratch the surface on this journey. I will definitely be utilizing EMAs, though from my reading there are other tools that should be used.
While I haven't considered day trading at this time because I have a 9-5, I plan on gaining knowledge in the coming days to begin swing trading by end of January the latest.
The market opens back tomorrow, and I've only been blogging since Friday night... I am excited to say the least. I think I will fund my Charles Schwab tomorrow to buy oil stocks after the news with the operation in Venezuela (or invasion), which means oil stocks will be booming. This is not something to be happy about of course, but realistically speaking, the wealthy will be pumping oil stocks, we'll see how it plays out.
Member discussion