SPY Study
Finding a pattern and actually understanding SPY is challenging to say the least.
I found an almost identical patter for March 24 and May 15 - the story almost reads the same. If the same pattern were to be repeated and traders repeat their behavior, then we can expect the next two days to be low.
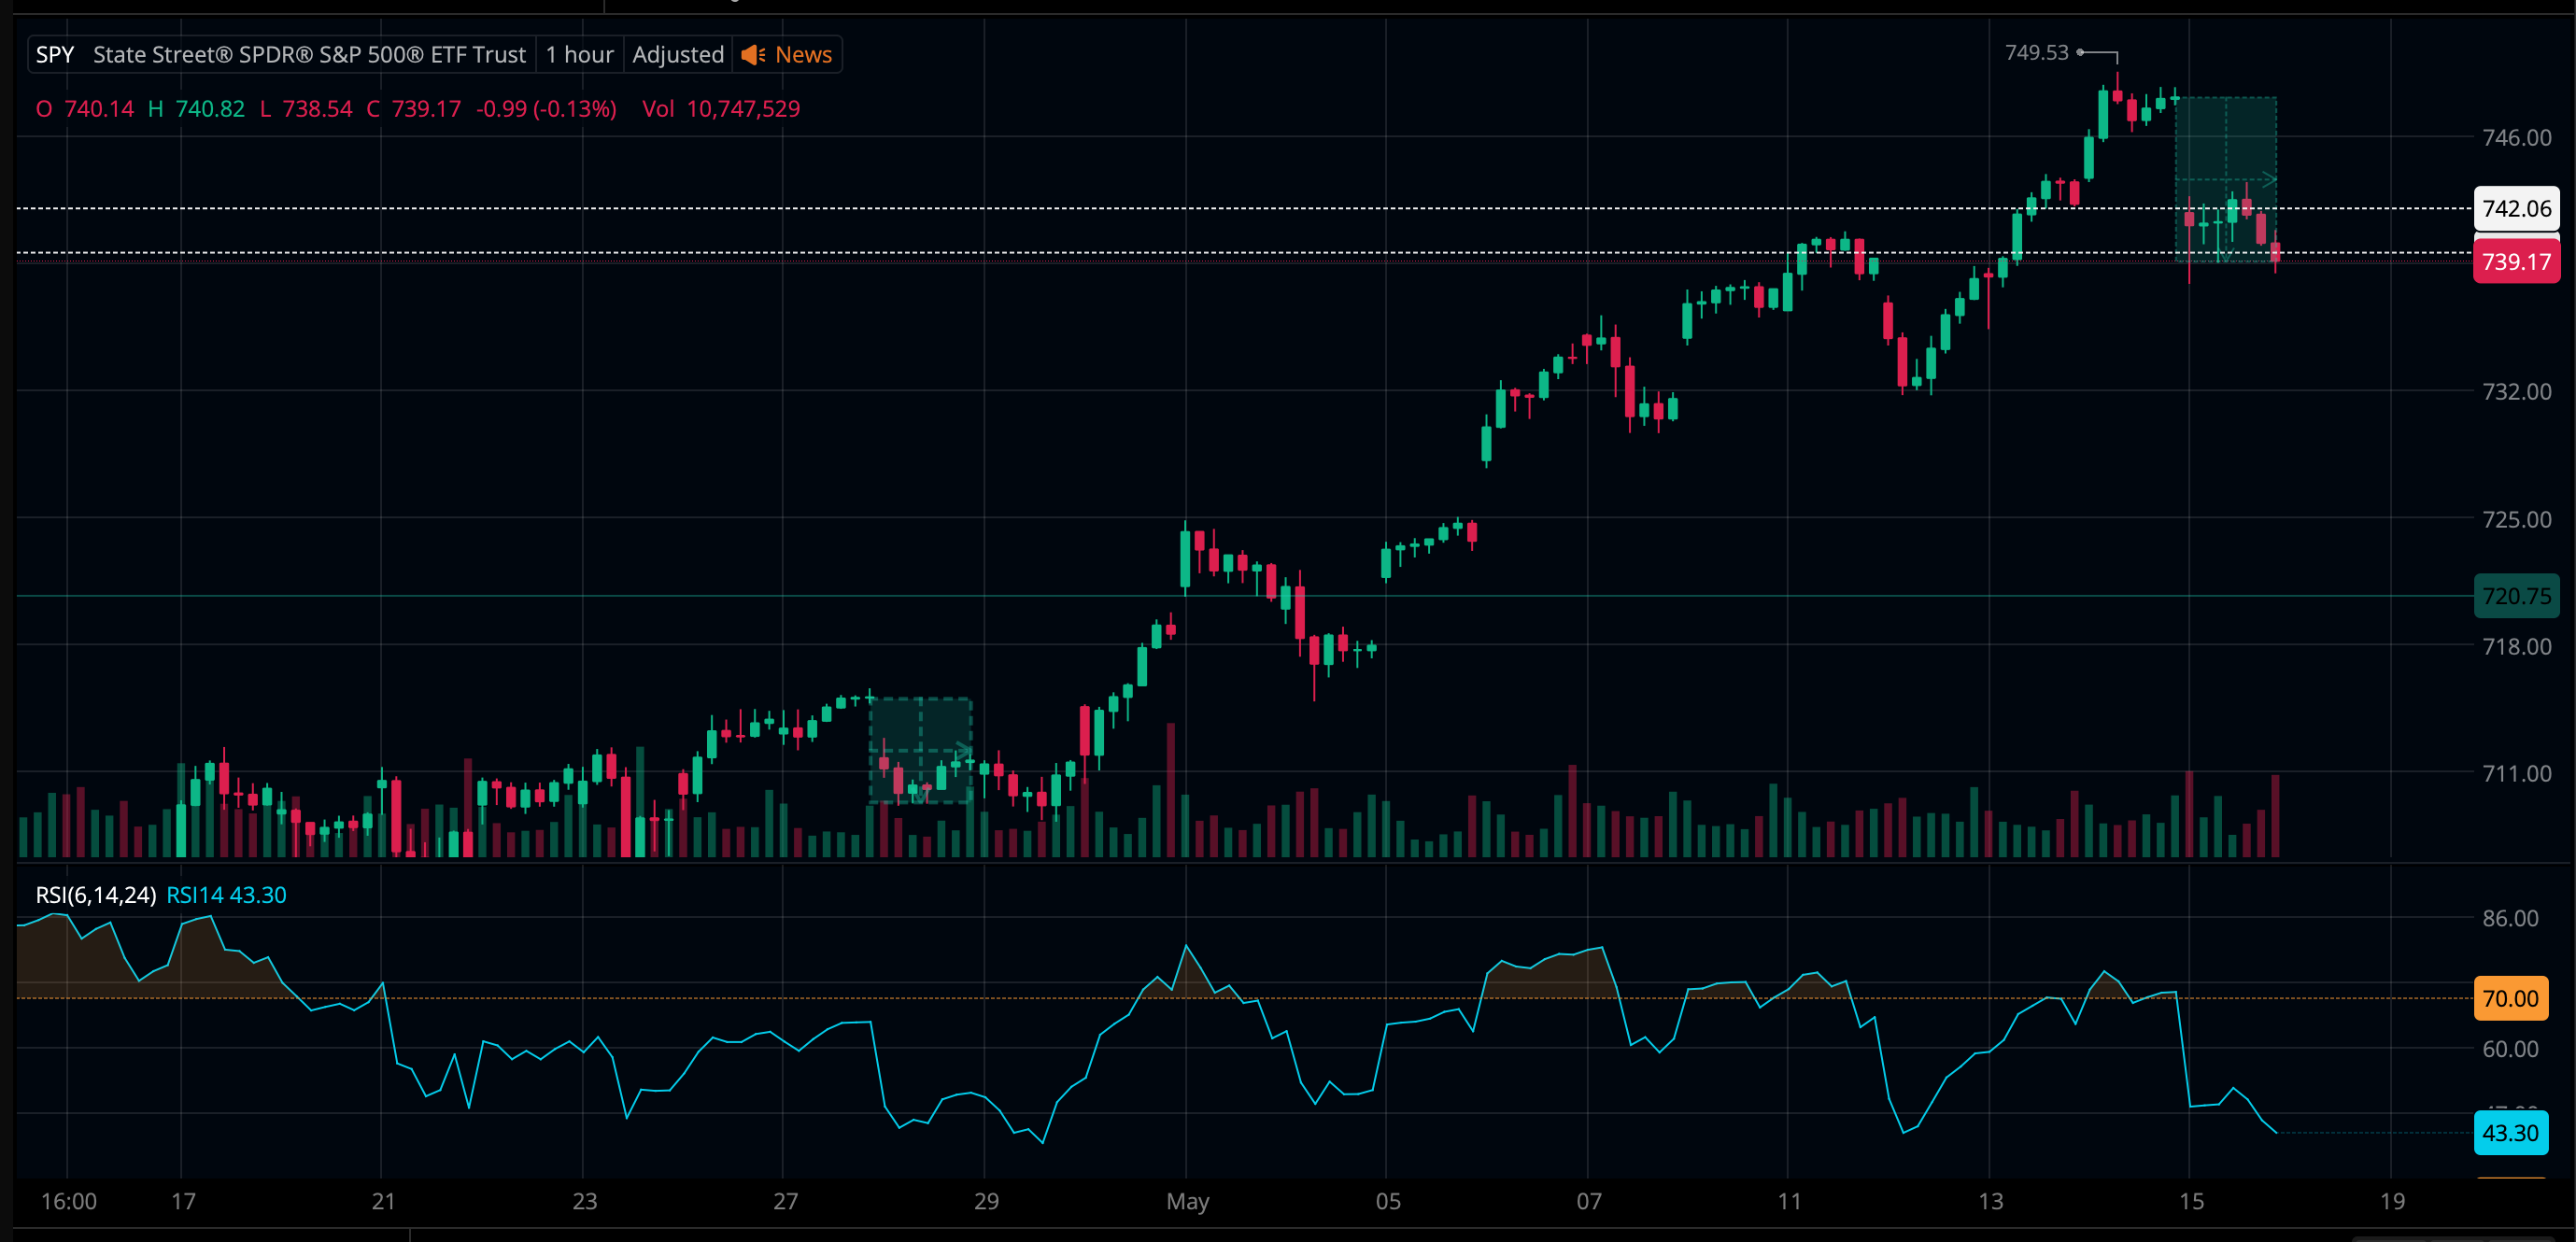
In the above, I've highlighted two boxes where the history seems to be the same. Again, if the behavior of traders is the same, then we can expect a change in price for SPY for tomorrow almost as drastic as the on in May 28.
Running a statistical analysis on these two days I've concluded that:
Date: Mar 26, 2026
• Open Price: $652.06
• Close Price: $645.09
• Price Change ($): $-6.97
• Price Change (%): -1.07%
• Intraday Spread: $10.03
• Trading Volume: 96,494,400
Date: May 15, 2026
• Open Price: $741.79
• Close Price: $739.17
• Price Change ($): $-2.62
• Price Change (%): -0.35%
• Intraday Spread: $5.50
• Trading Volume: 60,290,000
As shown, the scale of the trade change on May 15 is slightly smaller (smaller volume, smaller intraday spread, and the price change is not too drastic, though the logic still applies for me.
Tomorrow is my second day doing this (SPY), so we'll see how it's paid out. It's exciting to see if it works, and if it doesn't then I narrow down my opportunities to find a good edge.
Member discussion