Types of Divergences
In last post, we talked about divergence and we established that it is a technical analysis. Typically, the price moves in the opposite direction of the indicator (RSI or MACD — which we discussed before). There are 4 types of divergence: regular bullish, regular bearish, hidden bullish, and hidden bearish.
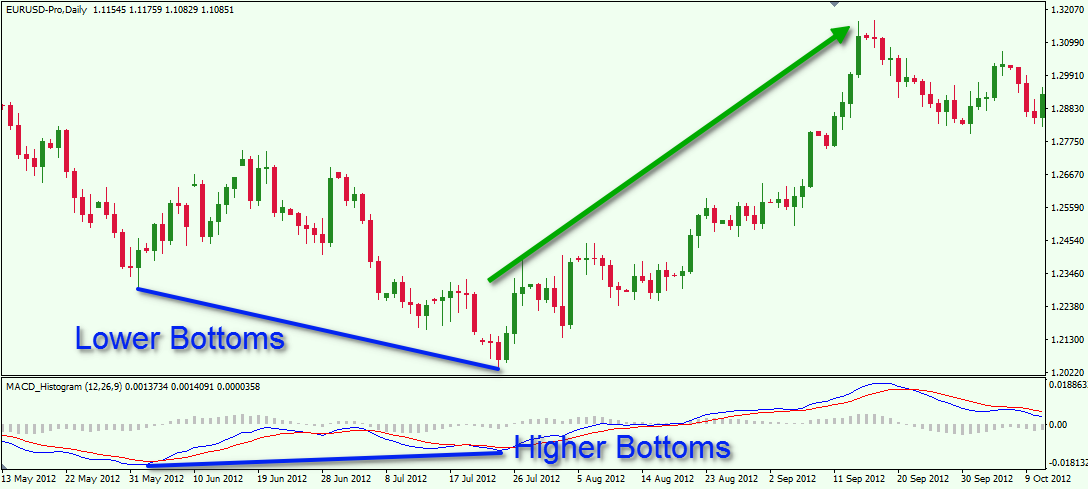
Regular Bullish
this type occurs when the price reaches a lower low, while the indicator creates a higher low. this indicates that sellers have less pressure to sell, this then opens up the chances of upward reversal
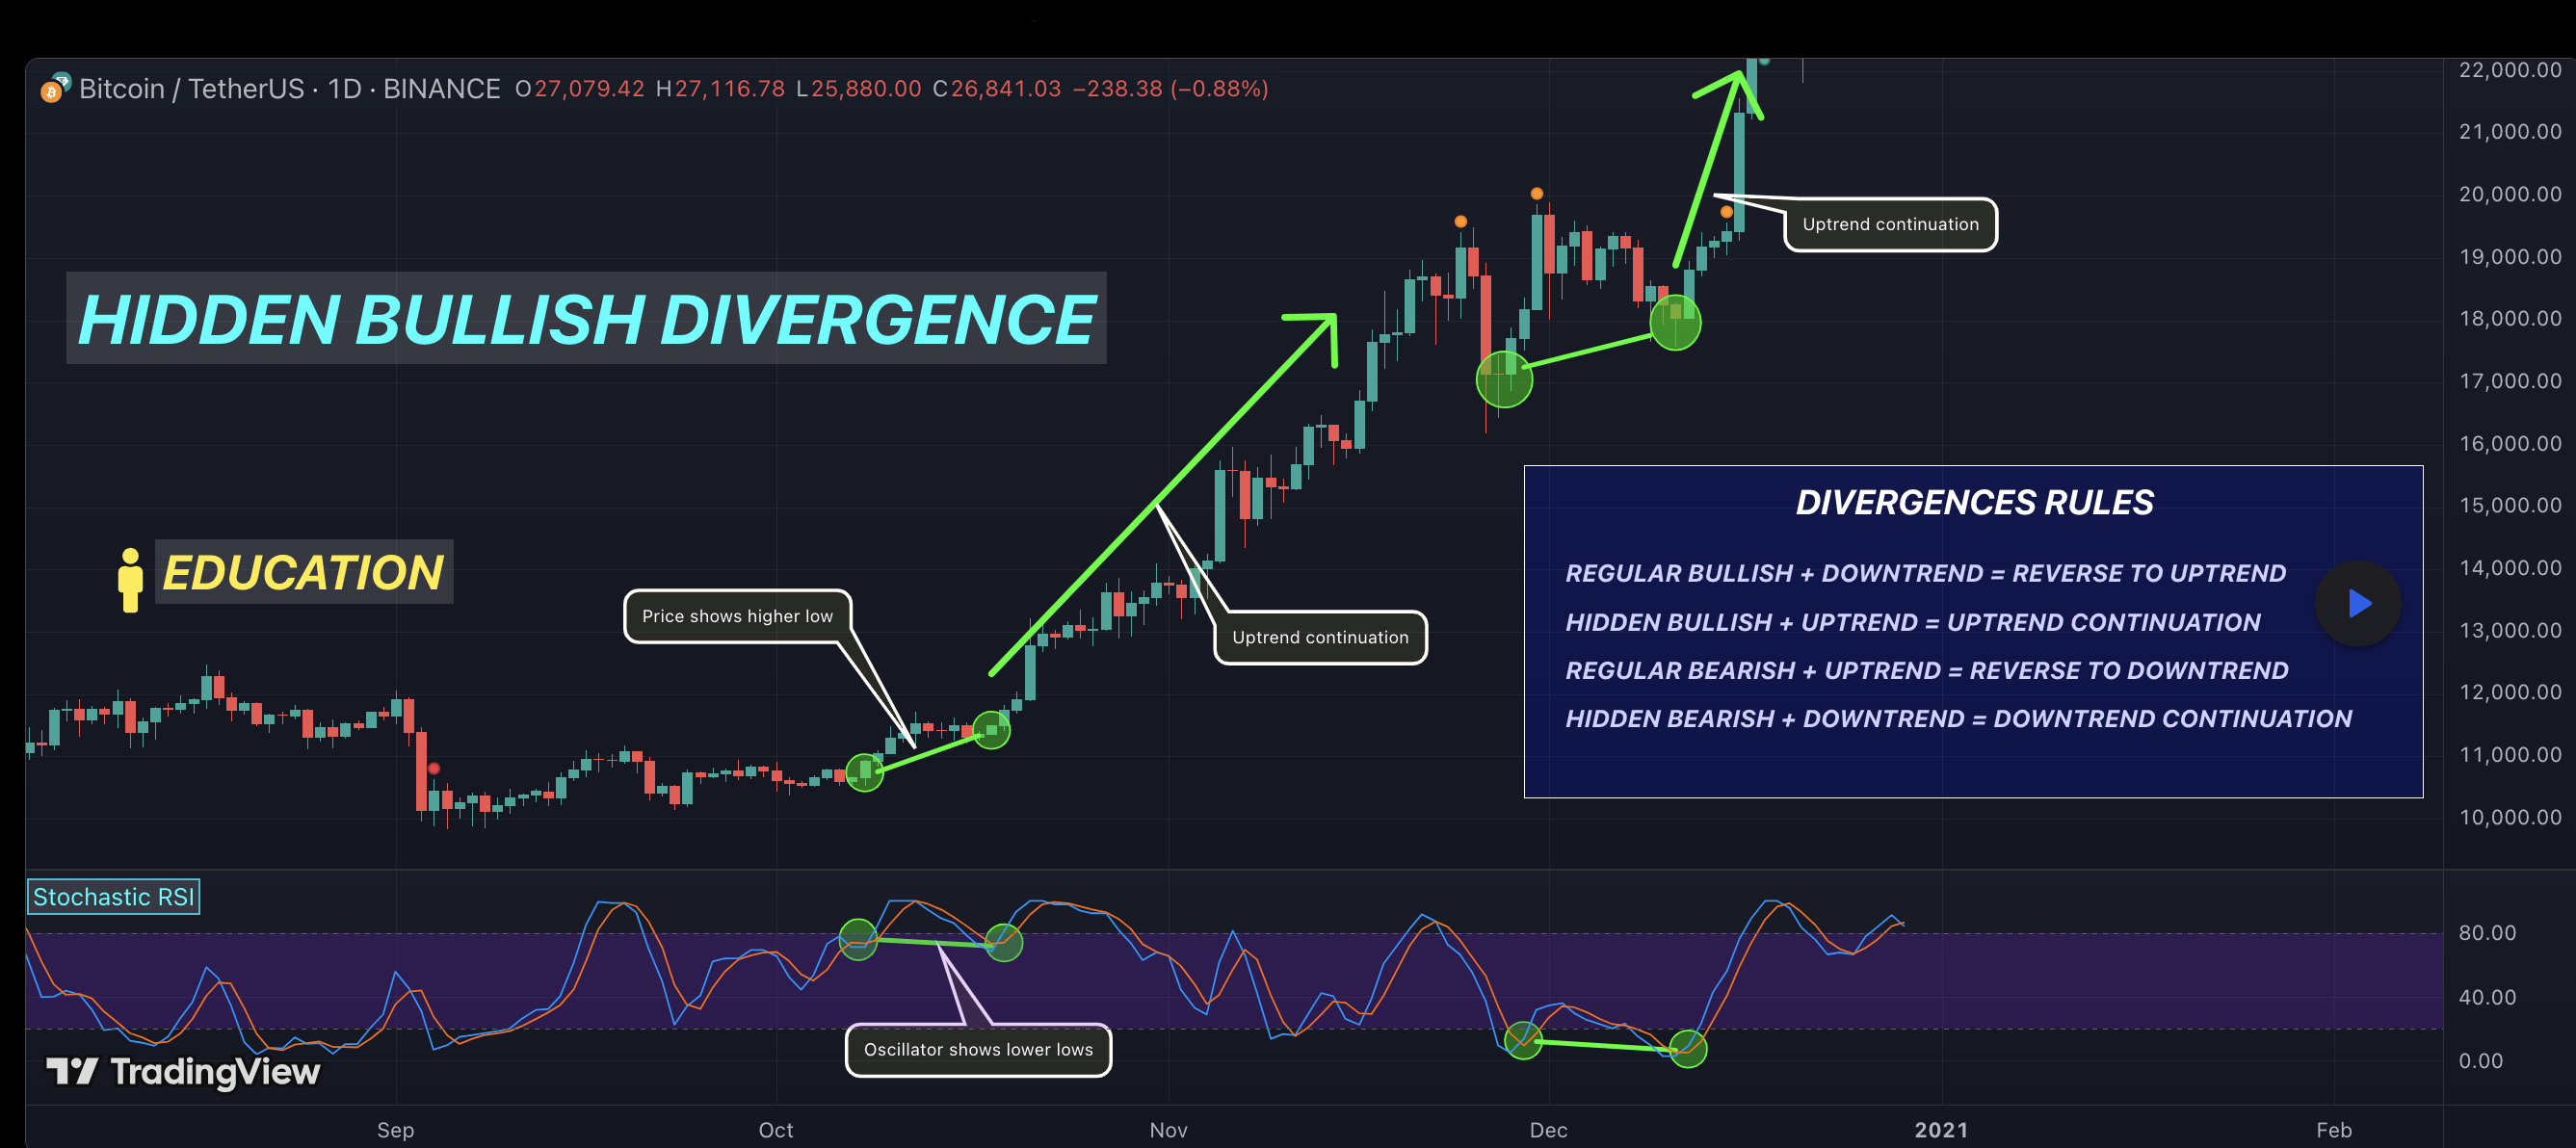
Hidden Bullish
This indicates a strengthening of a pattern and supporting an existing uptrend. This can be observe when the price reaches a higher low, but the indicator creates a lower low.
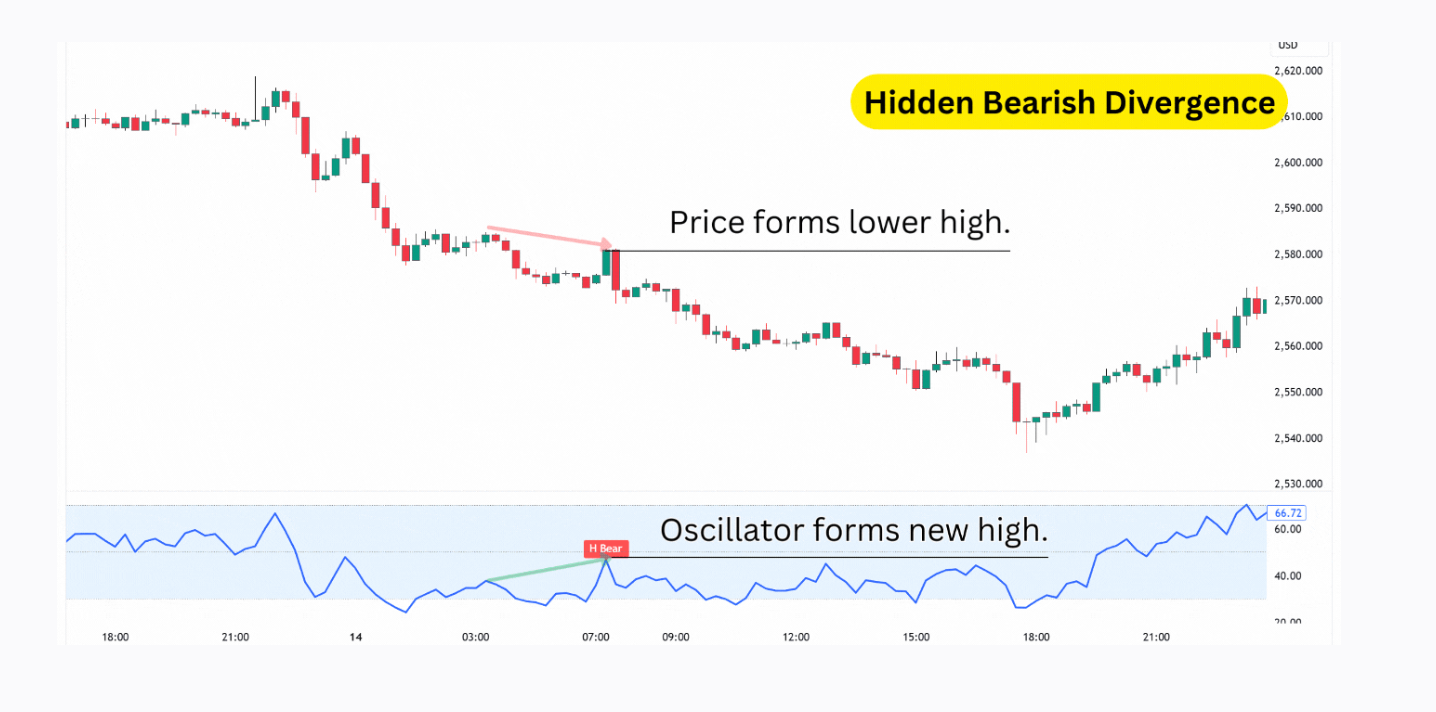
Hidden Bearish
This signals traders of a trend continuation, reinforcing a downward trend. The way to identify it is by observing a lower high price, but the indicators marks a higher high. (This makes me think of the RSI immediately – the concept of the price reaching a lower high, begins the selling momentum. At this time, the RSI goes, and if we remember there is a bound of 30-70, where the 70 indicates overbought, this then sometimes suggests a shift in reversal.
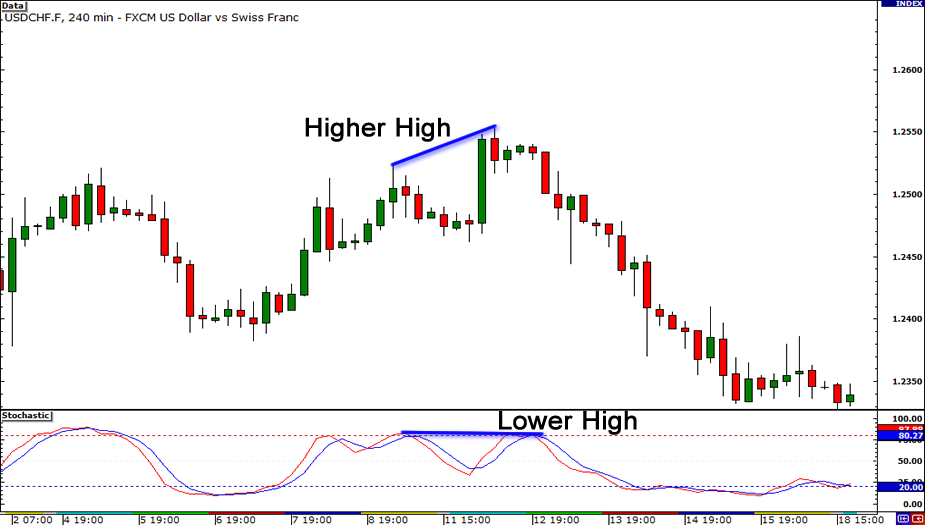
Regular Bearish
Regular bearish signals a potential reversal from bullish to bearish. Price creates higher high, but the indicators lower highs. This also reminds me of RSI, but this time on what it occurs at the overbuying exhaustion.
This is interesting to learn. To get a better understanding of it instead of theory, I will continue to revisit my open call contract $NKE, and see if we can apply what we learn.
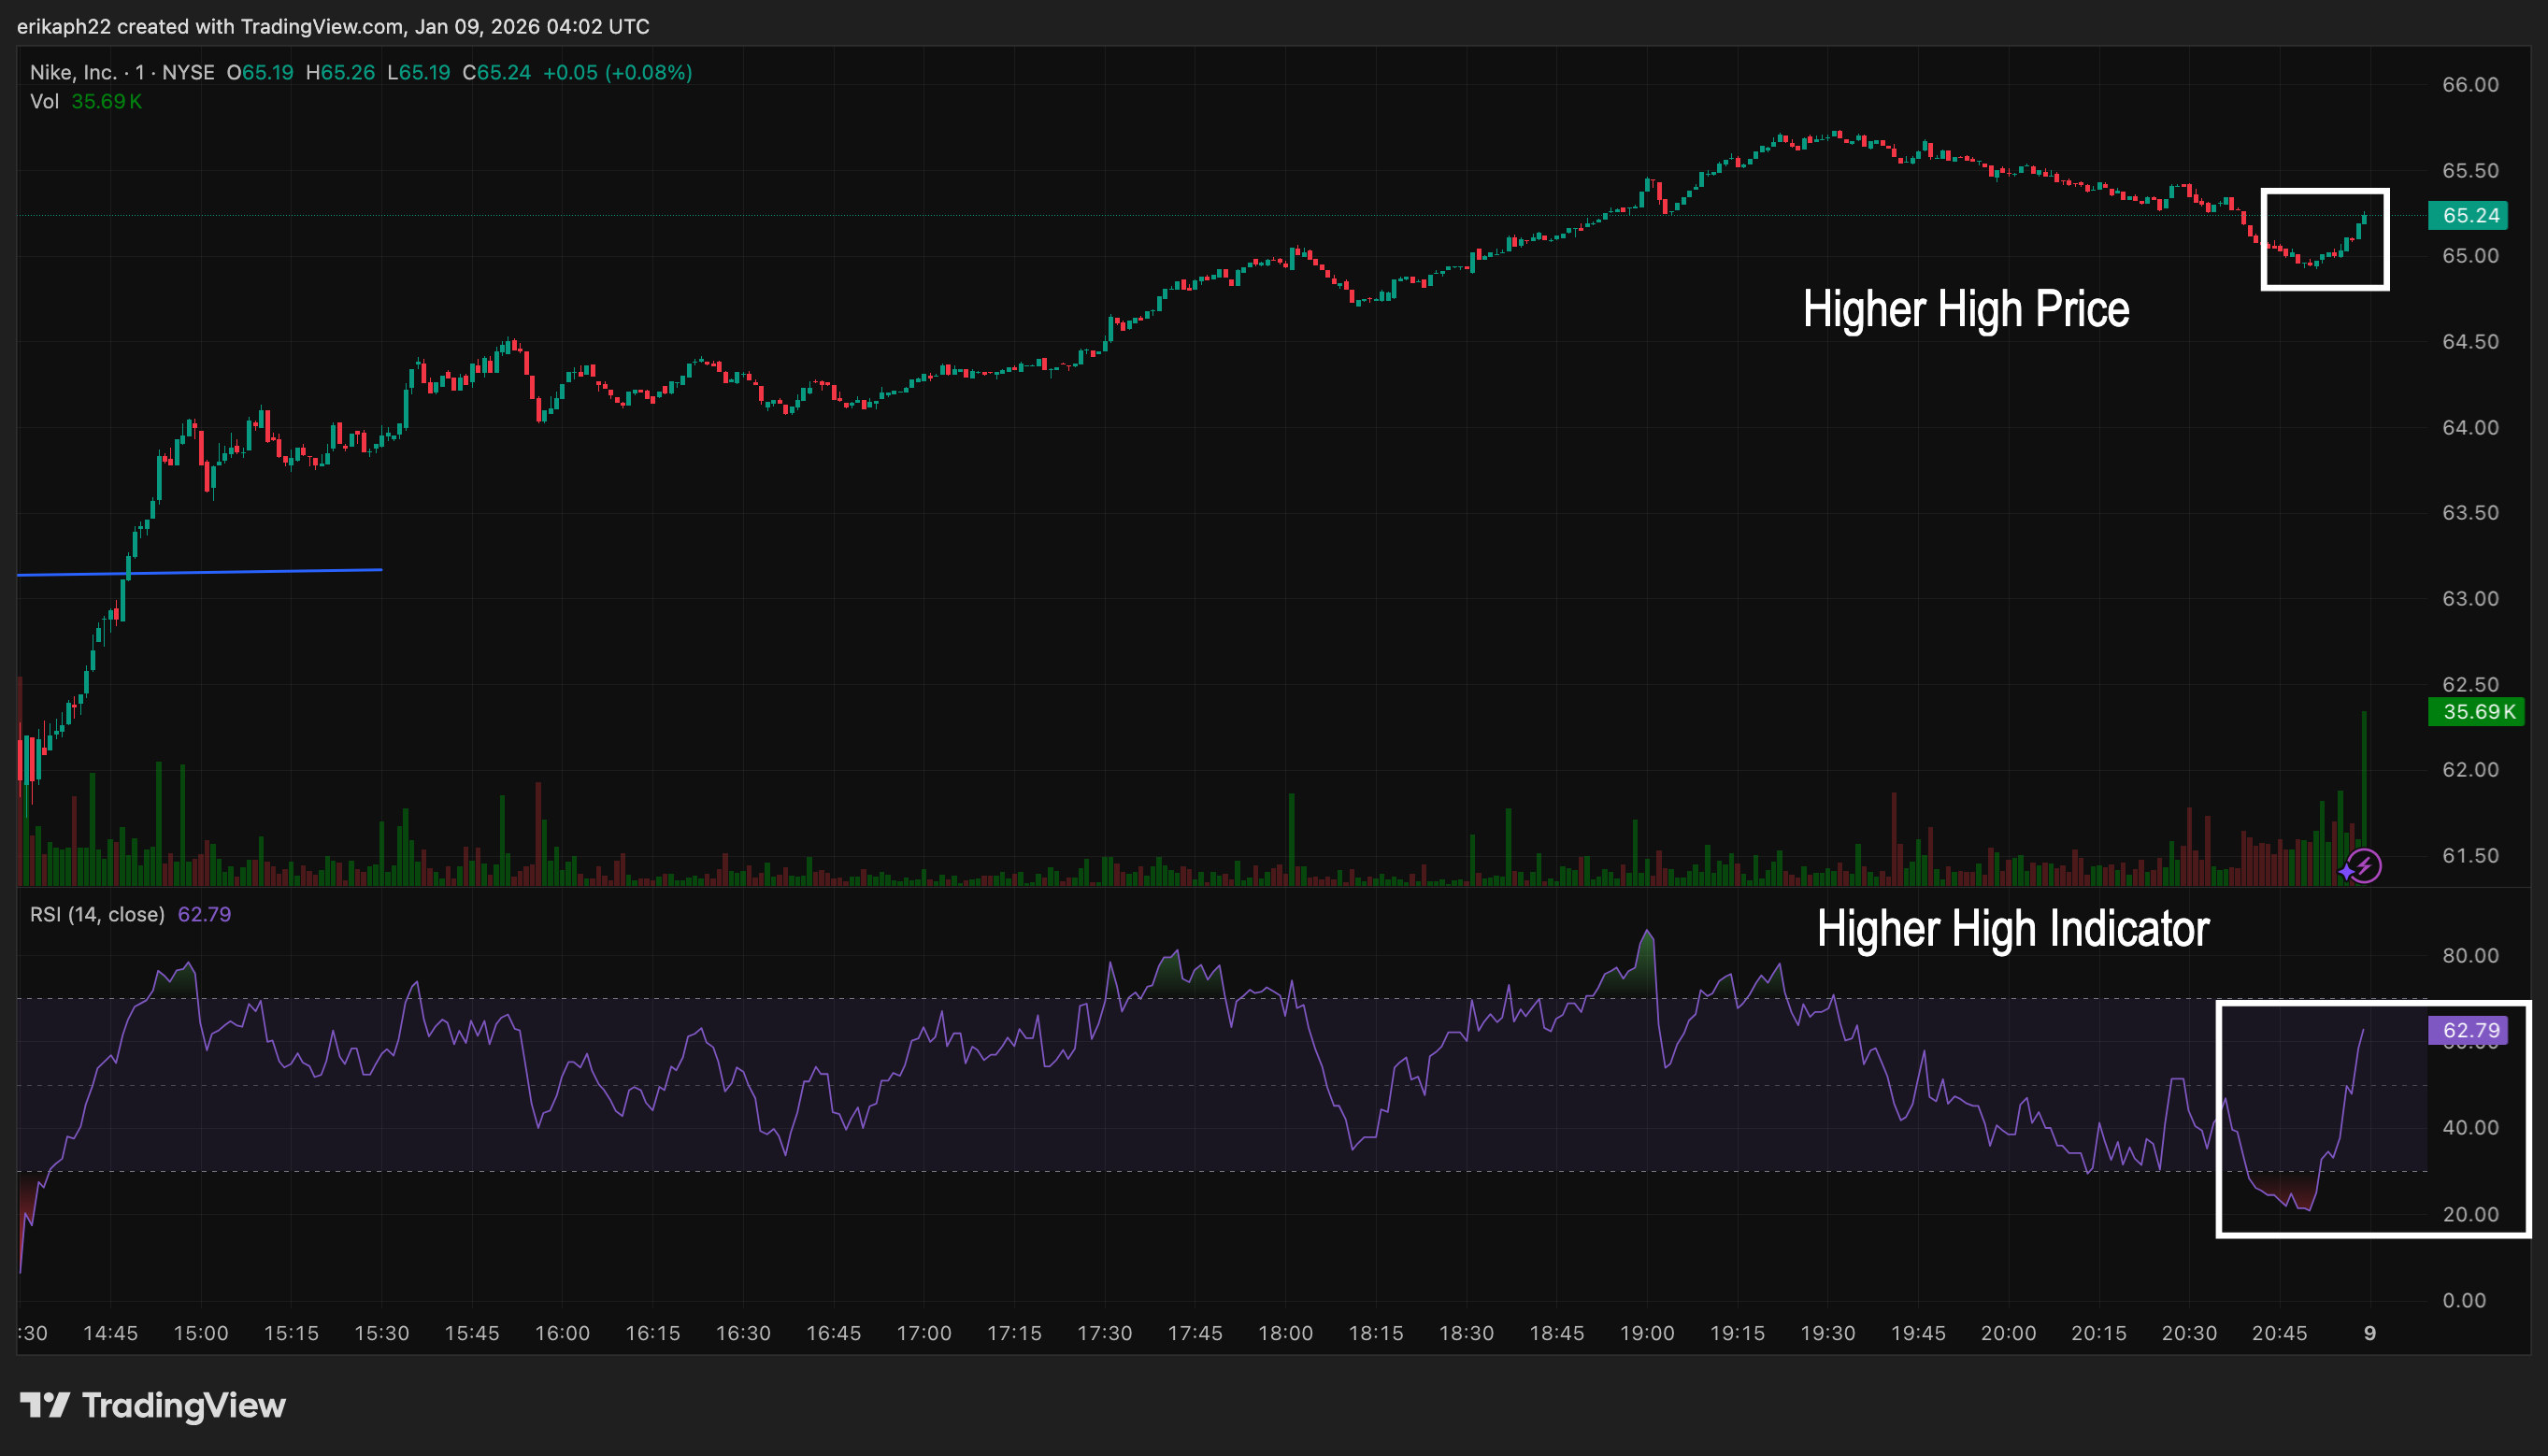
While the chart is only representative of one day only, if we were to be day traders now or even swing traders, I would probably buy. Although the RSI seems to be 62, close to the "overbought" concept, the above is based on one day only, so I believe the price will remain steady for a bit before shooting up. This concept is known as convergence as the two RSI and price confirmed the trend.
Final Thoughts Today
Today was the first day I saw profit on my new contract of $66 with break-even price of $67.50 expiring on January 23. Given what I observed in today's divergence and applying it with the RSI; I can say that I strongly believe I will make profit on this second contract.
Again, there are many factors non related to the patterns, chart reading, and techniques that may abruptly change the trend of a stock. I will read some news on Nike tonight and see if there's anything relevant.
Member discussion