Weekend Observations - Next Run
I took a break from everything on Friday (yesterday). I didn't monitor the market, I didn't write, I didn't study it. I think the blogging part was the mental challenge, but it also felt like I had nothing to write other than reflections. While that's all good, I wanted to reset to come back fully and make sound analyses and decisions.
With that said, I did mention that I'd use the weekend to see how it affects the stocks. Do the trends hold up? We know there is a lot noise in the news, and a lot of the times this impacts how the market behaves. I've learned though, that it may only affect things temporarily (a day or two). So, I'll go back to using the same method I've been using to identify waves, except, I'm looking for more precision. Let's start.
Positive ETFs Performance
On Friday April 24, there were four sectors that culminated the day in the green; the rest closed their week in the red.
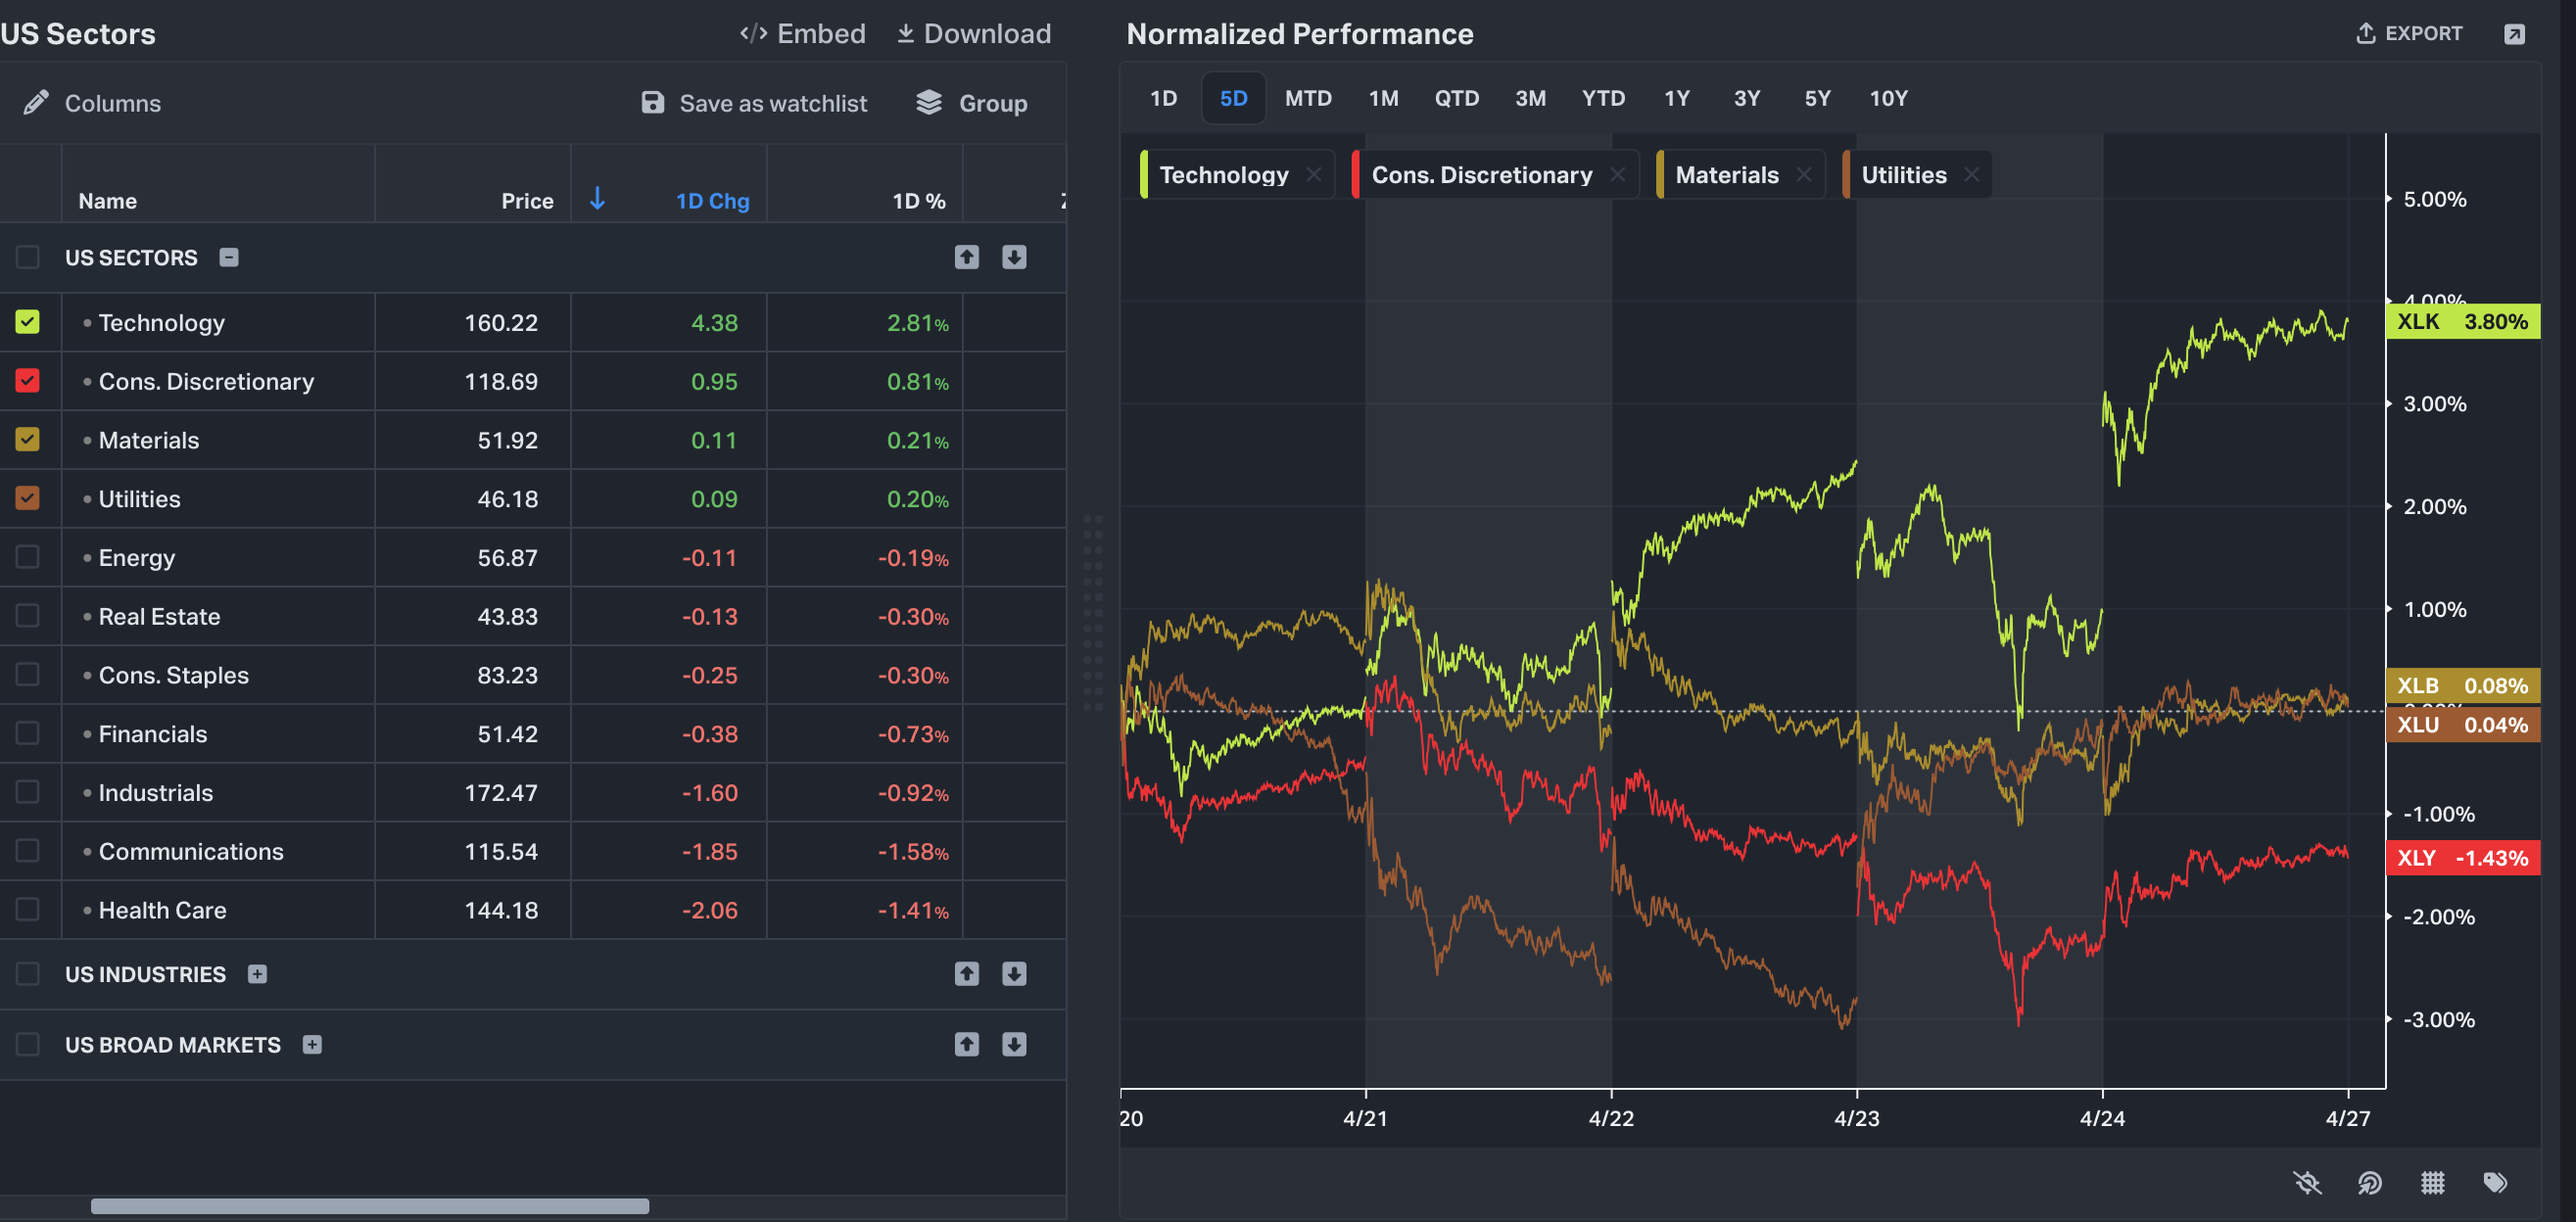
In the above, I've filtered for the positive performing ETFs, and next to them, we have the 5 day performance. As seen above, XLK (Technology) was the highest performer on April 24. Utilities (XLU) and Materials (XLB) have performed more closely. However, I am more focused on Discretionary (XLY) – I have my reasoning and I'll dive deeper into it).
While it is tempting to go for XLK, as it is the greatest uptrend, it does make me hold back for a little until I erase my losses. Although to me, XLY and XLK mirror each other, just at different scale.
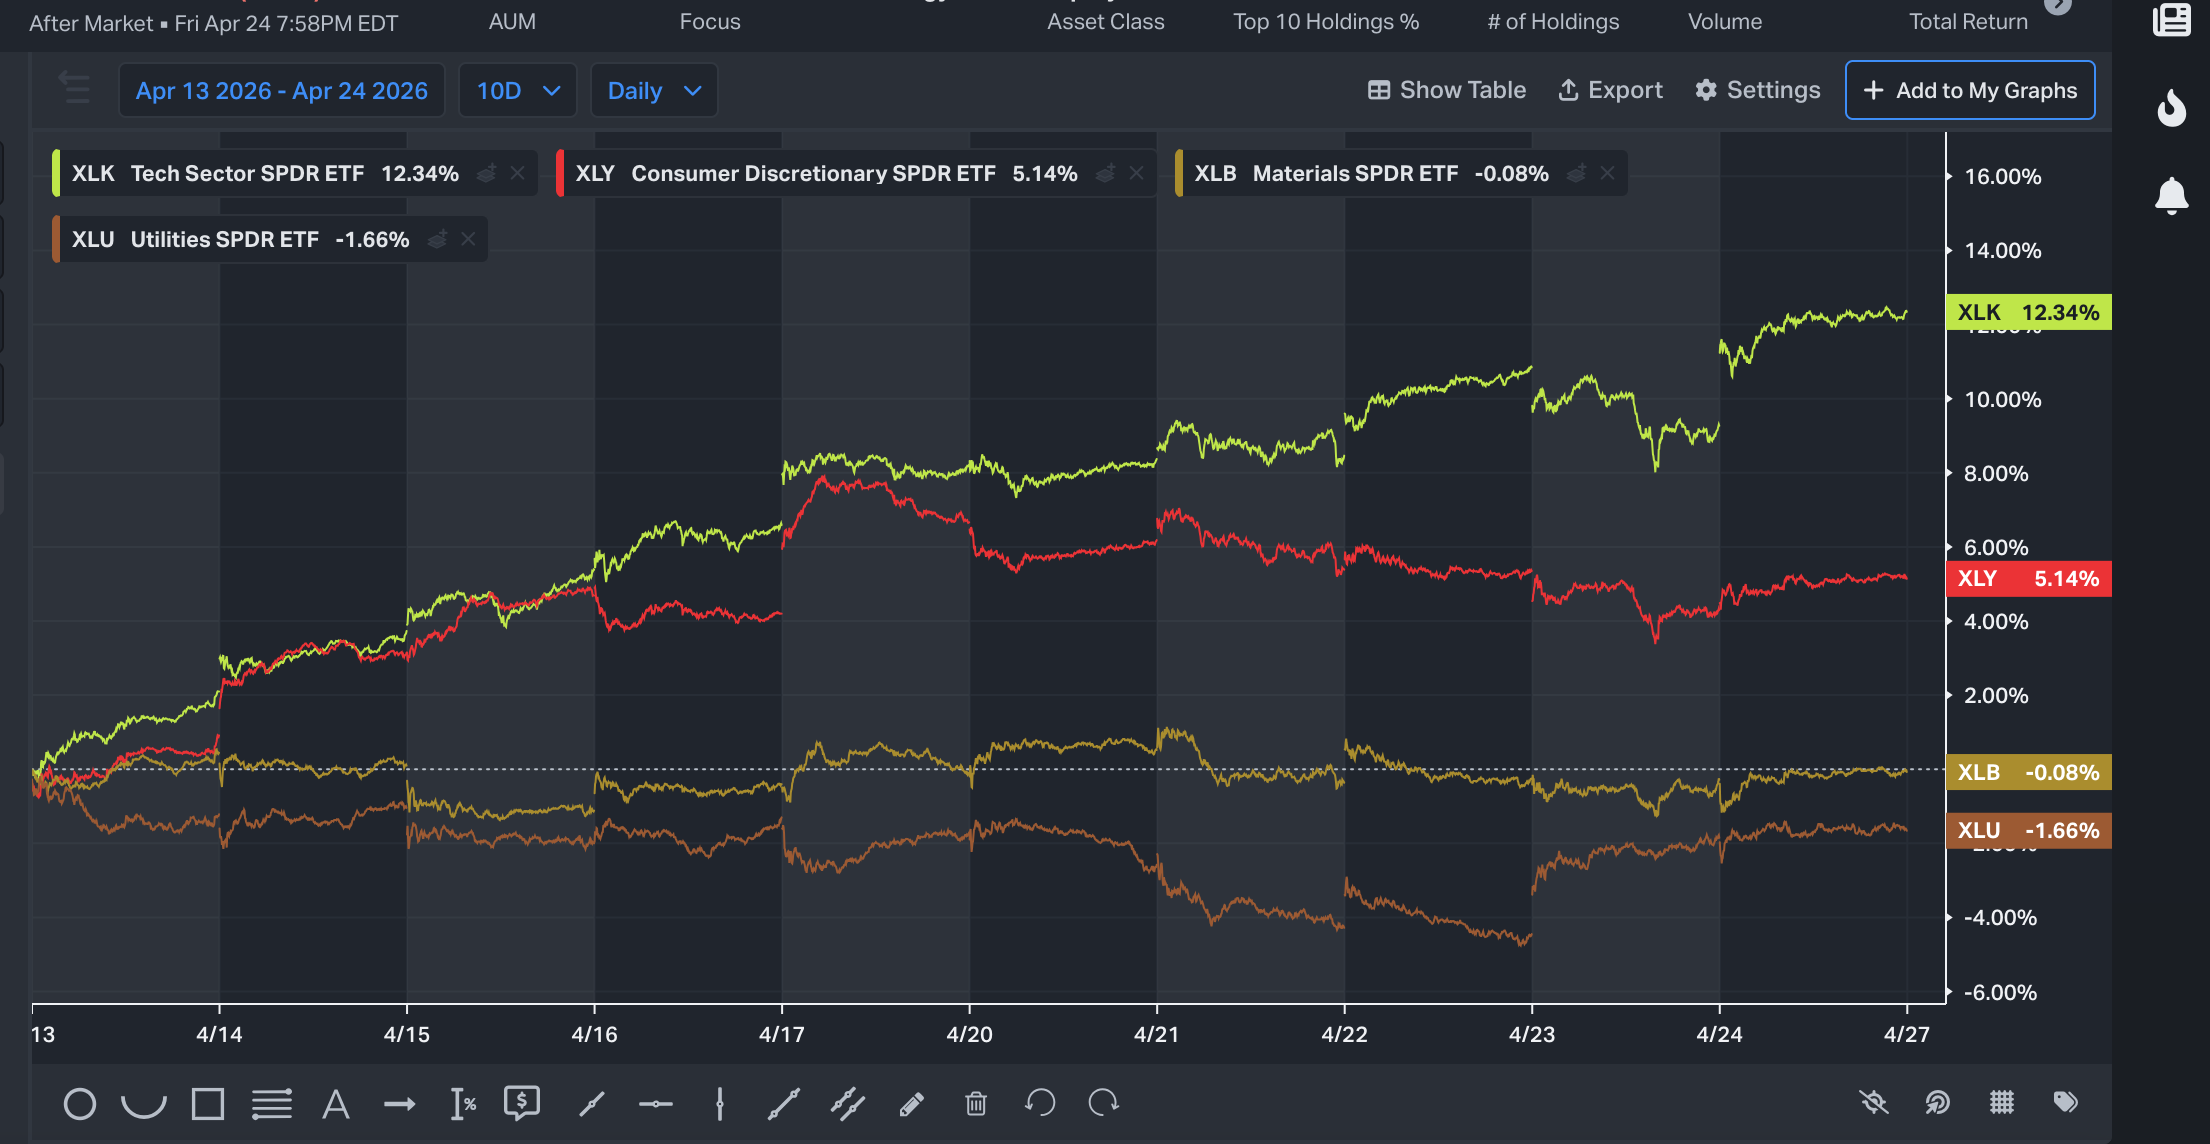
Looking at the 10 day performance, XLY's highest was around April 17, I believe, it is currently trying to pass that high from that day. XLK on the other hand, is a bit more volatile. Whereas if we look at XLB and XLU, they are steadier and the two have instead dropped slightly over the last 10 days.
So, with that in mind. I think I will be looking at something at TSLA for XLY.
If we look at the chart below, I've assigned a channel where resistance is $390 and support $369. At the same time, I added a line observing the trend for April 23 and April 24. Visually, I noticed a trend for April 9-10 that looks similar to the current uptrend. As mentioned in my last post, it seems that the sweet spot for my method is the first two days of uptrend or downtrend.
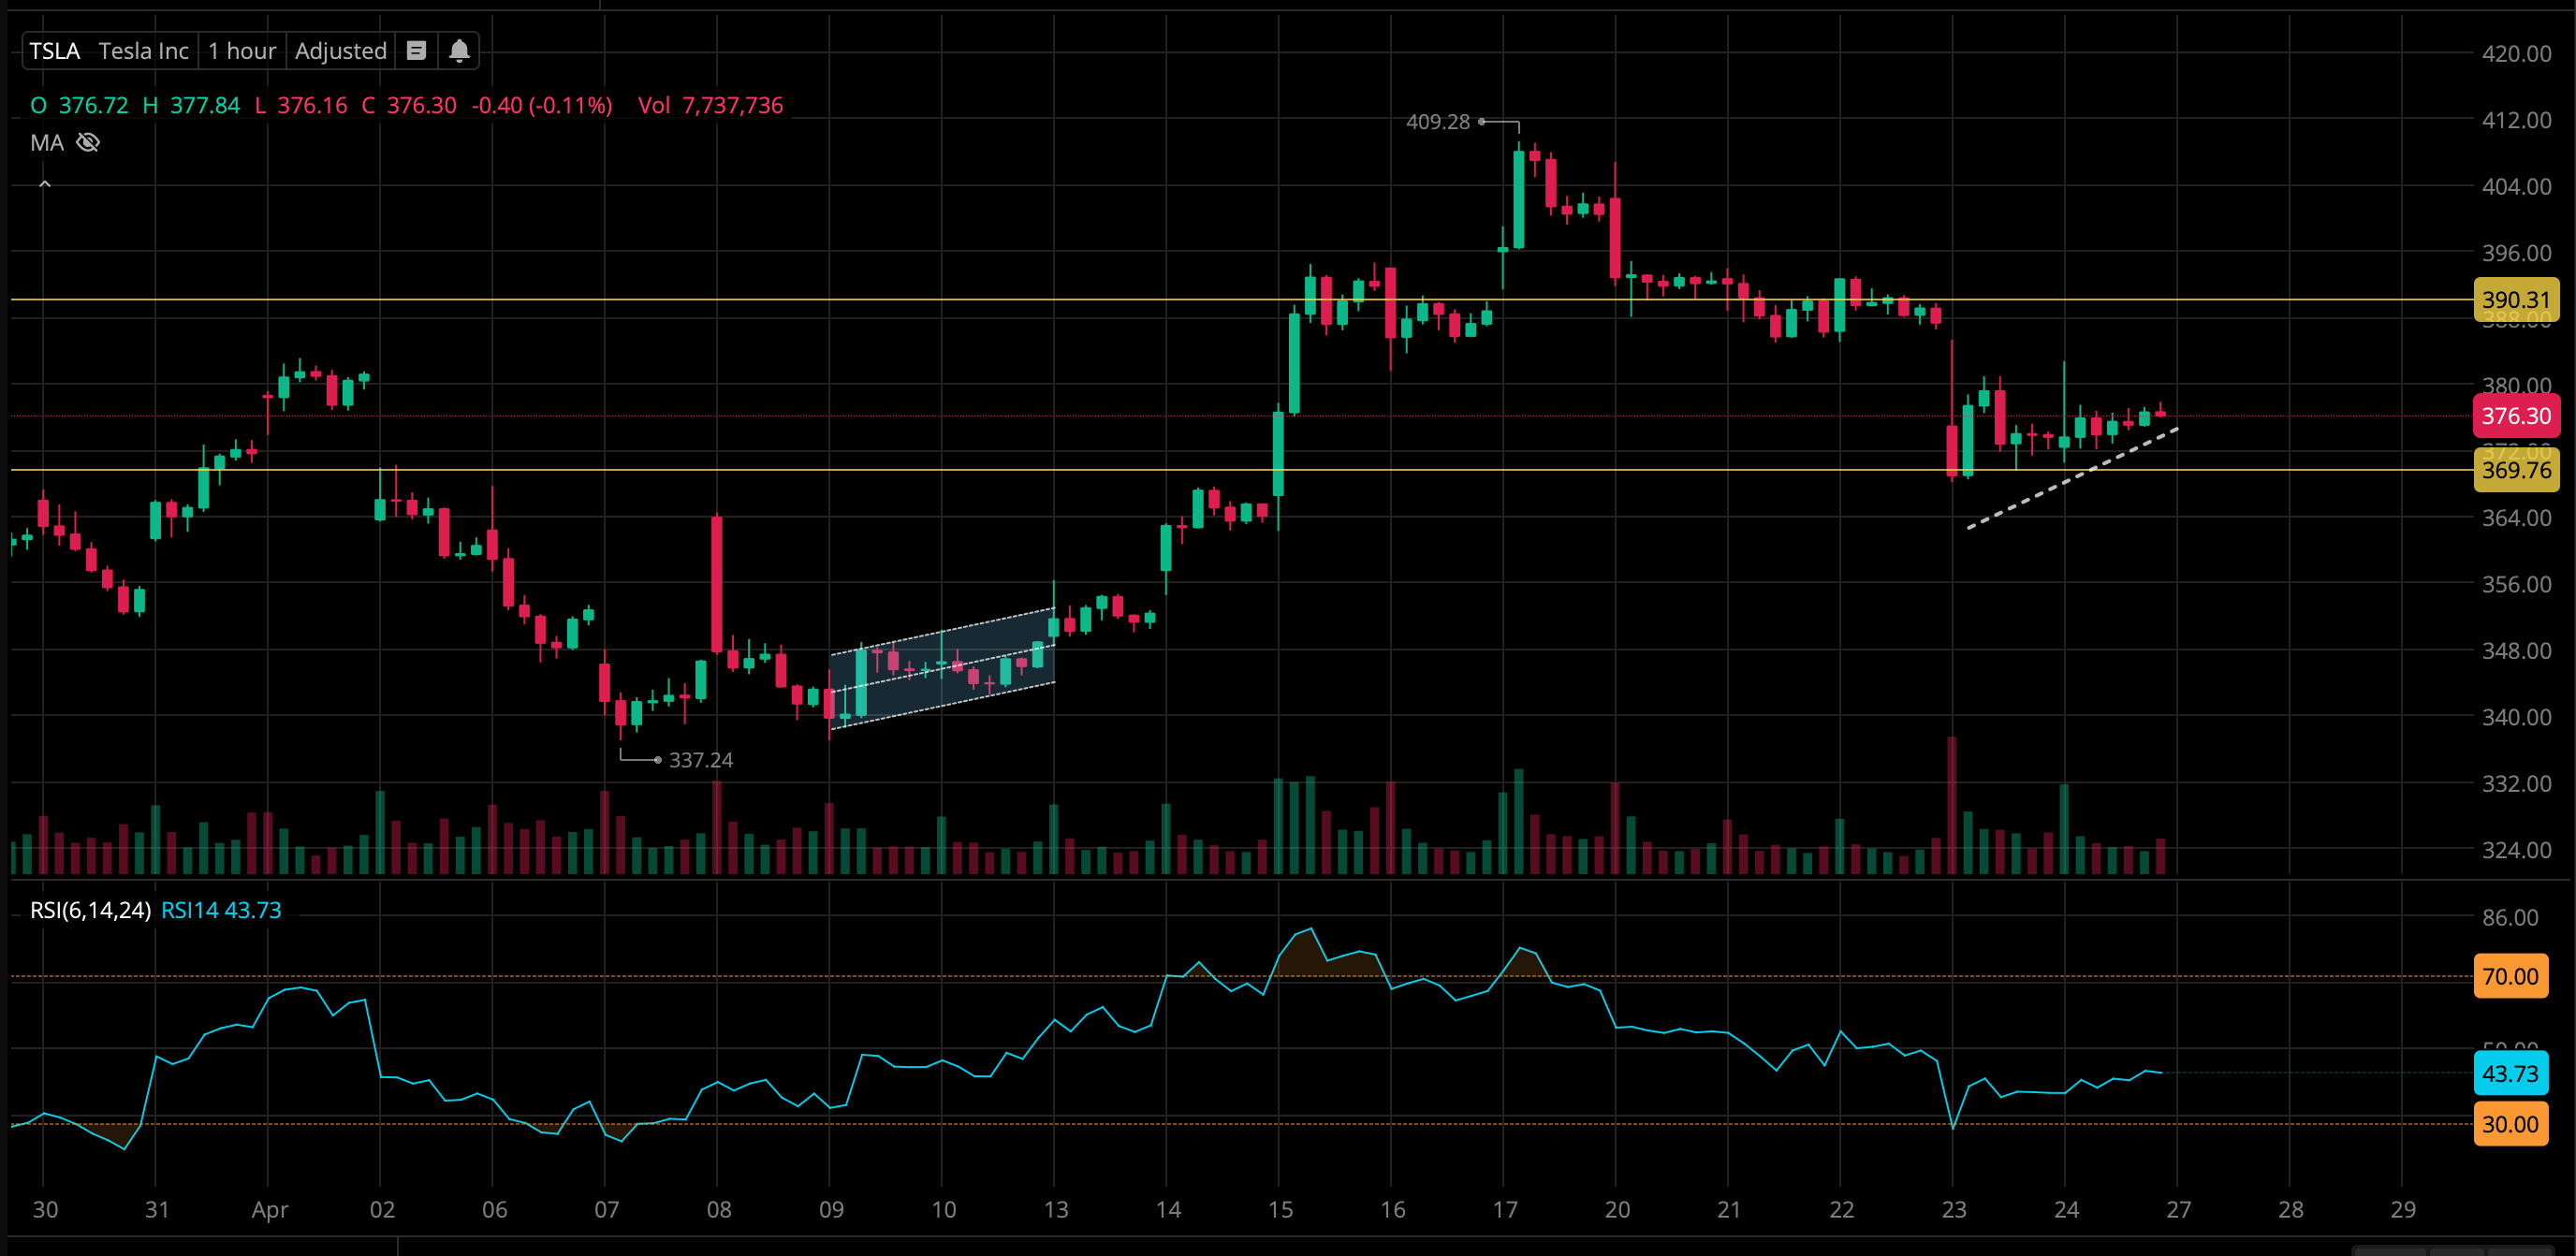
So, I am taking this a bit further this time. While I know that TSLA is one of the most volatile stocks in the market, seeing a visual pattern (April 23-24 & April 9-10) made me dig further and see if the numeric trend is similar.
Below is the analysis for April 23-24 where I'm looking at the trading volume for the two days, and the percentage change price for the stock between the two days. As shown below, although April 24 had fewer shares traded, the price for TSLA increased by 0.69%
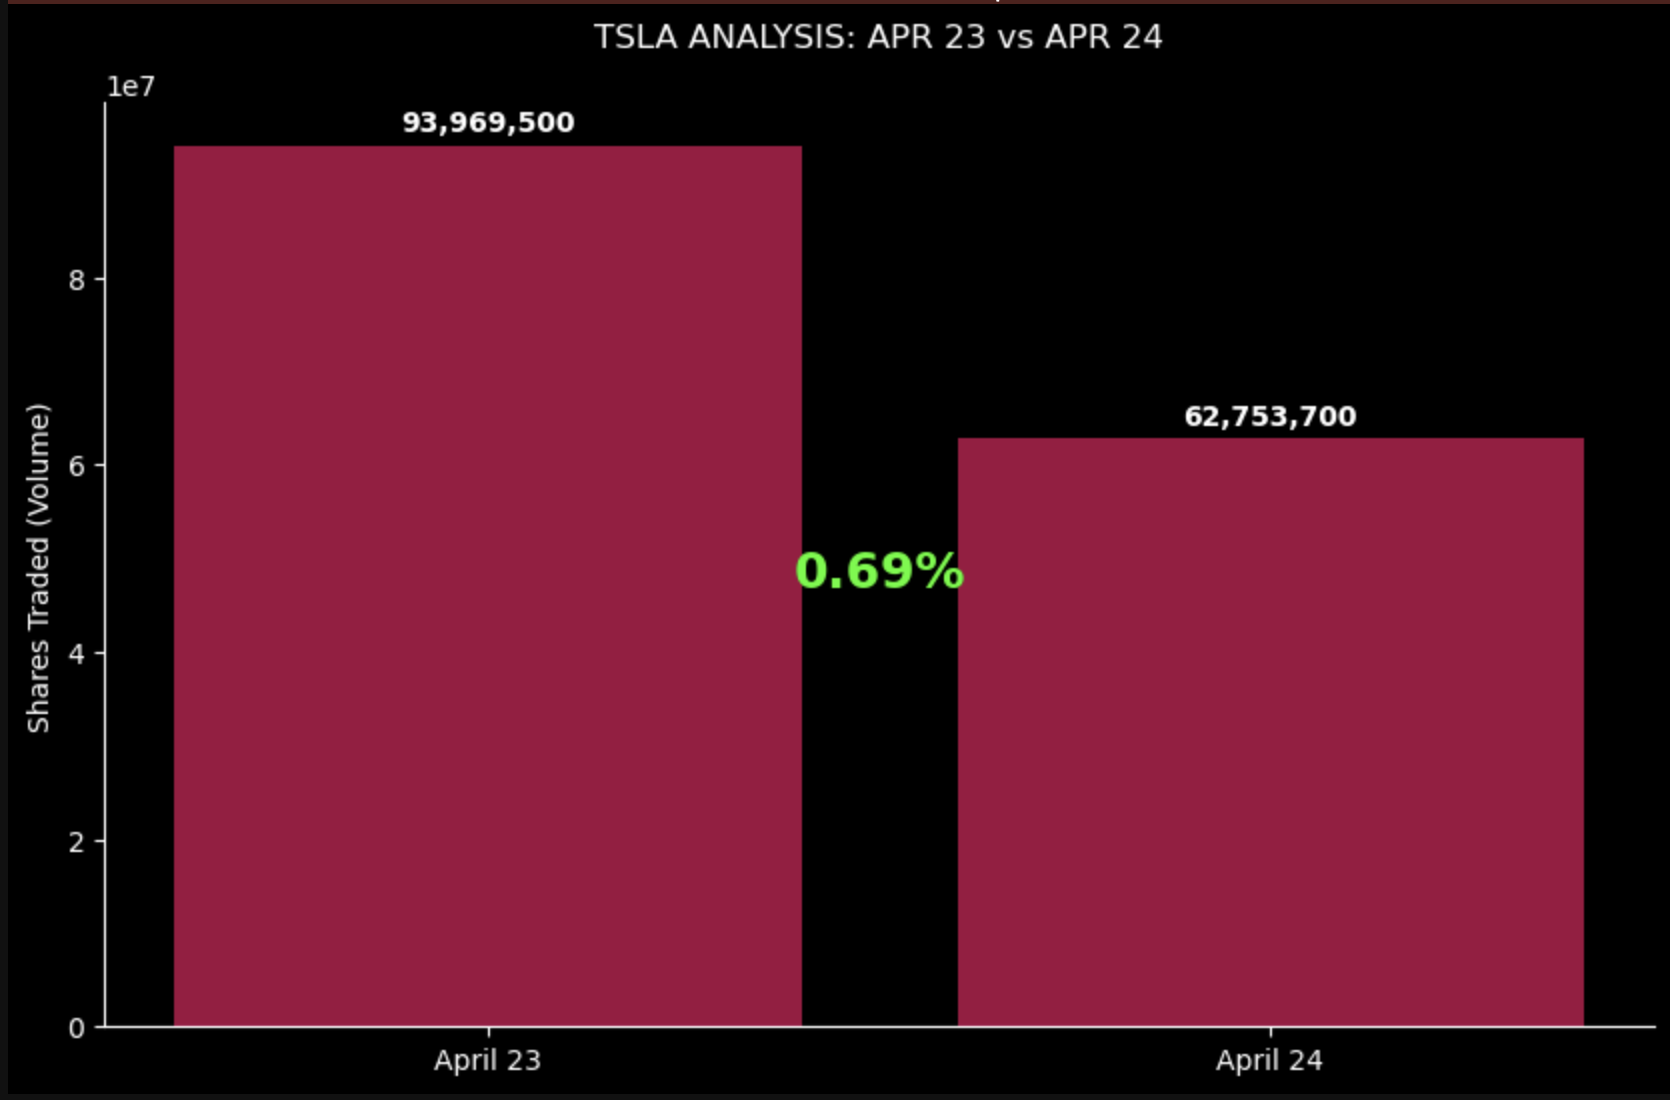
I've performed the same analysis for April 9-10
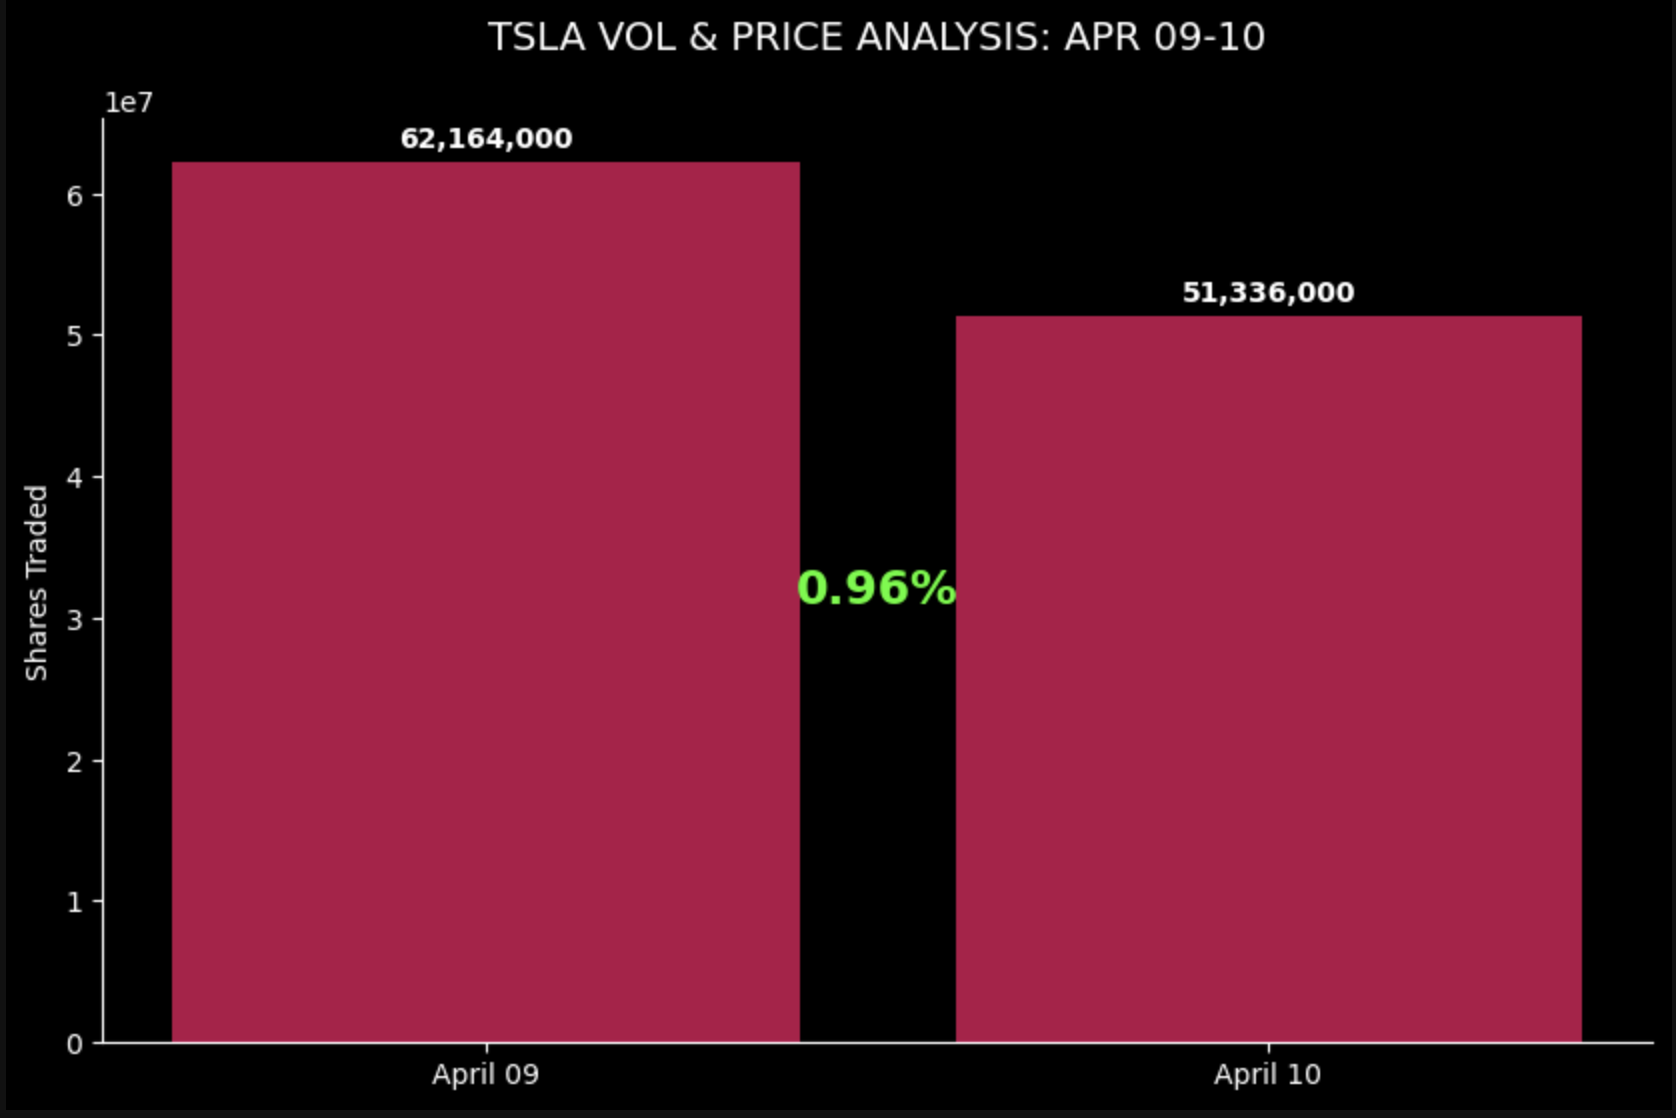
The pattern holds, although the volume in shares traded decreased, the price of TSLA increased in April 9-10 as well. If we refer back to the TSLA stock chart, we can see that from April 13-17 we saw a bullish run and had a 15.91% gain in price.
While I didn't intend for the days to align in this analysis, it just so happens that April 10 was a Friday just like April 24. It somehow solidifies my conviction on this decision. As of right now, a call option with a strike price of $395 expiring on May 4 is priced at $3.50 – most of my calls that have succeed upon entry in the last wins I've had using my method have been around this price. I'll expect this price to change slightly on Monday. As usual, I don't trade the first 30-40 minutes. So, the price may go down or up depending on how the morning rush goes.
Overall Thoughts
Tomorrow I may look at another stock and perform a similar analysis, as mentioned, I recognize that TSLA is very volatile so the pattern observed may or may not apply to other stocks; we'll find out tomorrow.
I will say though, that I do feel a bit nervous. While I definitely trust my method as it worked the last three trades I took, the only time it failed was the third, when I held overnight. I discussed this and settled on it being IBMs report and how AI integrations shook the entire sector, affecting Palantir (PLTR). However, I do feel that feeling of trying again after a fall.
I've adjusted the entry slightly, I went back and saw that the sweet spot was right after the 2 days of uptrend observed. With this re-adjustment, I am testing a new wave again. I will ponder on this tonight, assuming it is a perfect entry and see profits within the same day, do I hold overnight? Of course, if I do, I will set a stop loss this time. Though I want to decide ahead of Monday.
Member discussion