$XLE Week Review
I have officially held $XLE for a full week and the price has gone up. Current contract is around $1.10 when my original was $0.67
Overall, I think it's been pretty steady, there has been a spike that then retracts back for some support testing. There have been days like yesterday February 10, 2026 where I felt a bit nervous about the price going back to $53.78 after witnessing a high of $55 the day prior. I didn't get out though, but at the time I did question whether I should've sold one contract to re-up the initial investment and keeping one open to see it play out.
Today, $XLE closed at $54.35 which is still a decent price with 21 days left for the contract to expire. I think next week we may hit a good $56 based on how everything has played out. Of course, I could be wrong as well so I am also prepped for it and if there are any urgent stop losses needed. Let's analyze the charts now
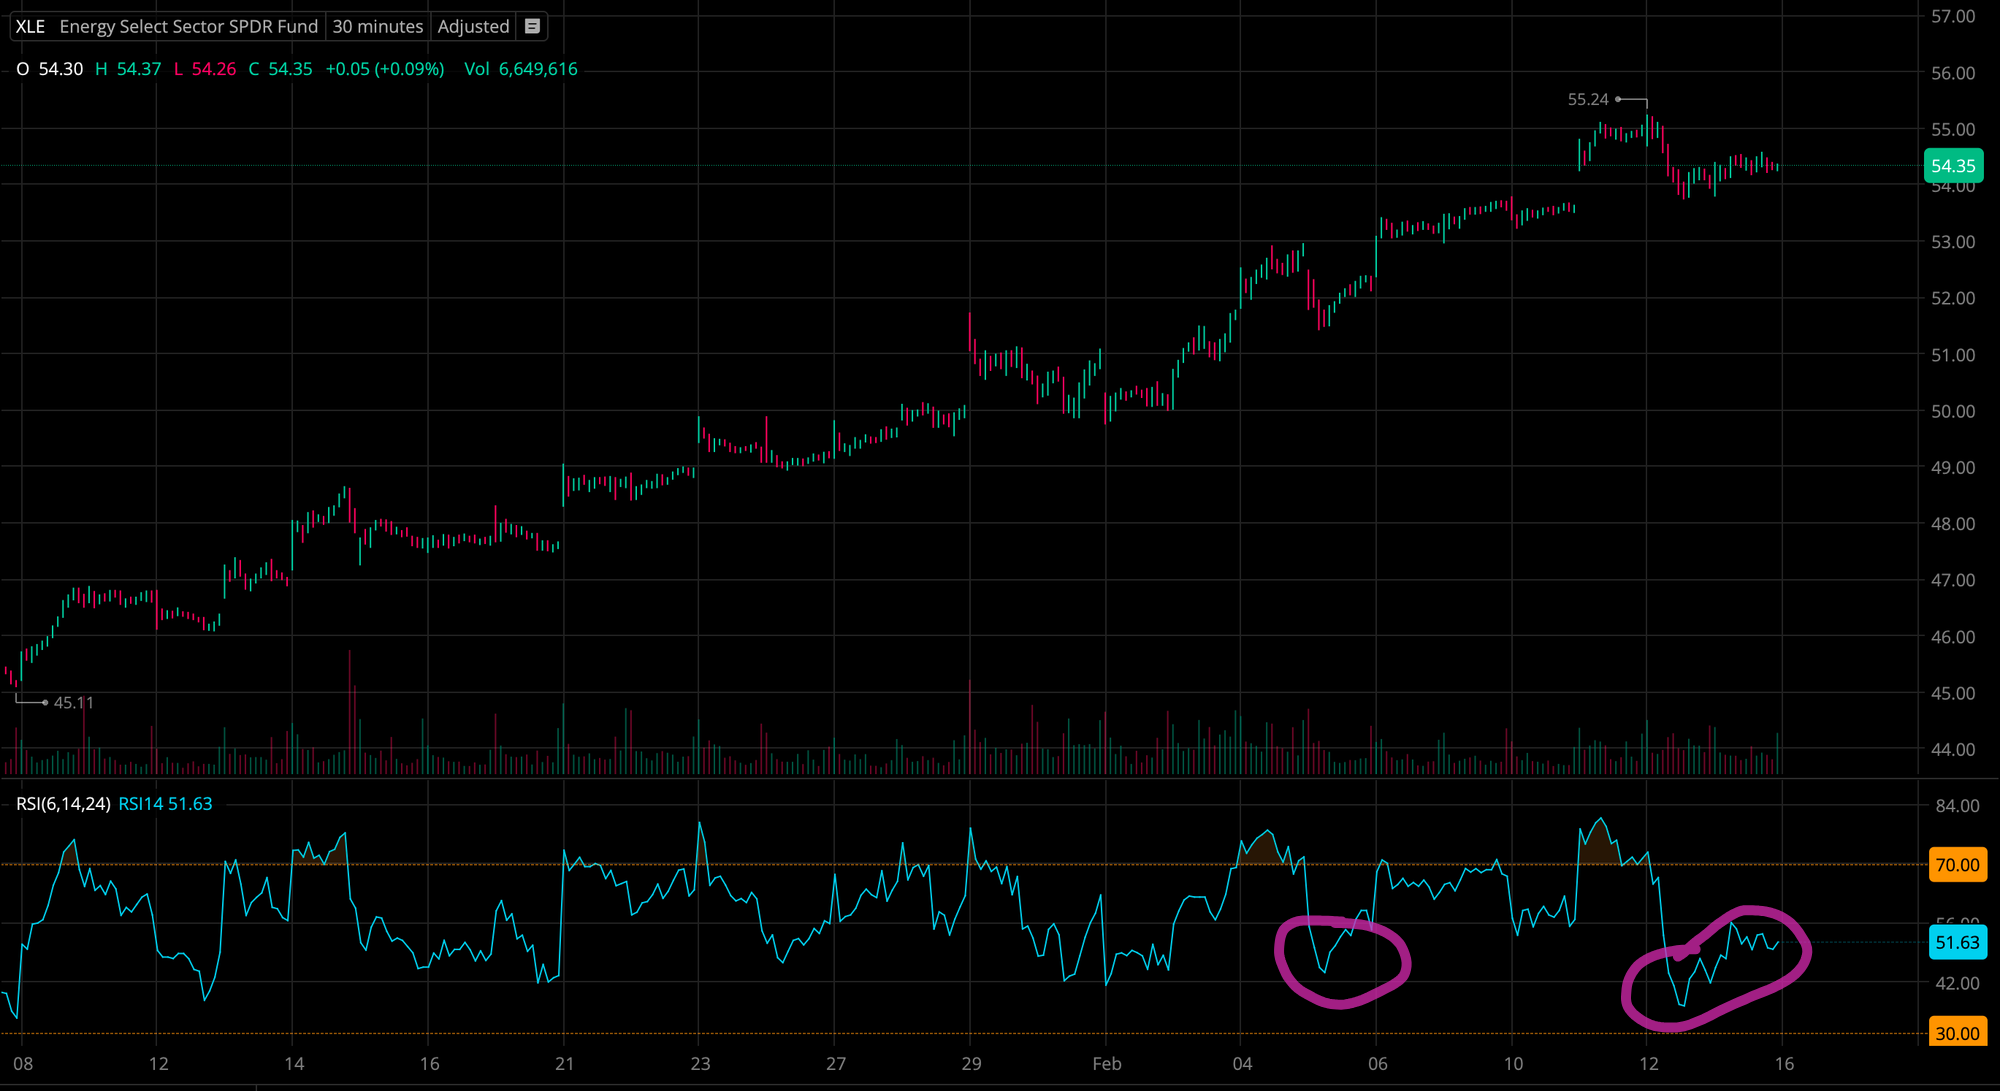
In the above, we're looking at a little over a month's worth of $XLE. As observed, the RSI has crossed the 70 mark consistently where it went above it on February 4, the day before I opened my contract and the pulled back the next day when I entered (see circled). As mentioned, I did freak out a little yesterday when $XLE went down to $53.78 after a high of $55.24 on February 11 where the RSI crossed 70 mark, but we begin to see the RSI re-stabilizing today February 13. What does this mean to me? it means I'm just fine, and we can expect another high early next week.
I haven't looked at MACD in a long time, but I will today.
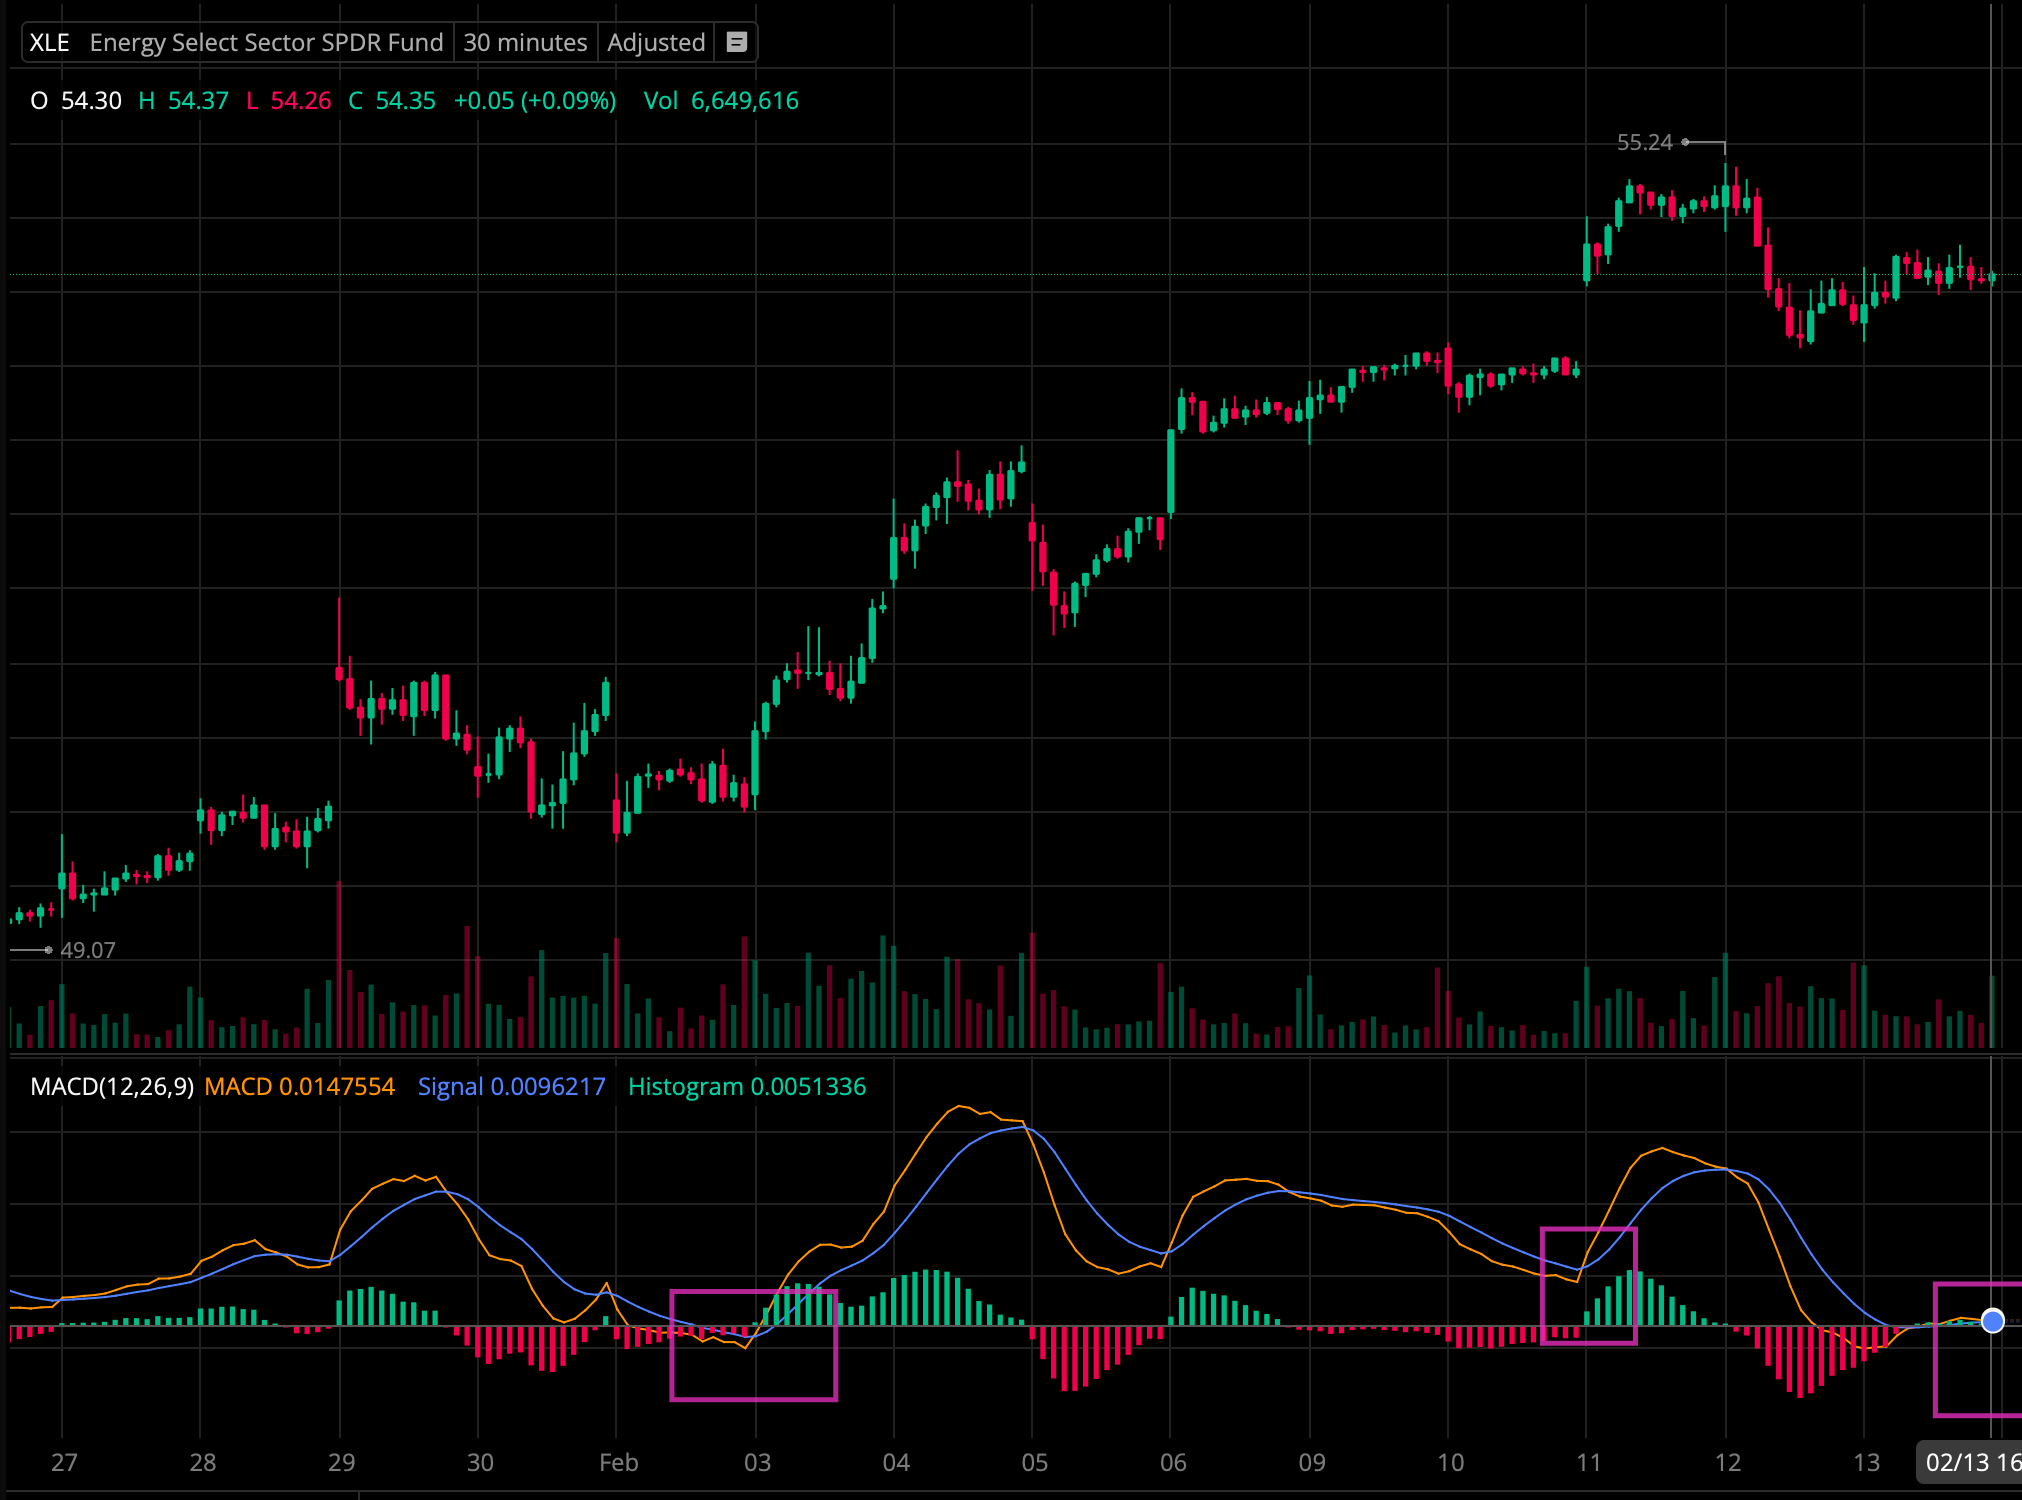
As discussed in the MACD post , when the signal line (blue in chart) crosses and goes under the MACD line (orange), it is an indication for buying momentum. I've highlighted the moments in which this was indicated in the last 14 days. We've seen this happened on February 3, when the price then went from ~$50 to high $52. Then on February 10 end of day, we see another cross where the price was ~$53 and the next day – February 11, we see the new highest price of $55.24. The trend seems to be repeating for this end of week, which indicates a buying for us, and we may even cross $56 early next week. Who knows?
Lastly, if I look at a defined channel and RSI, we can see that the resistance has been tested:

The new resistance has been tested between February 12 and February 13, but based on the previous indicators, I think it's still a solid investment. There was also a high trading volume today of ~63M, this has increased the volatility, but also confirms the MADC, which means that the price may be driven up next week. On the contrary, if the price stays flat, then I have to be on the lookout for my theta decay, and see how much it will increase.
Overall thoughts from this trade:
I think I had a good entry, I think I'm enjoying this strategy so far, and while I didn't expect to test it in an ETF, I'm not mad about it. Part of me wonders if this is the move for me for a minute. I will begin to explore other assets over the weekend to begin analyzing in case I do close my contracts next week and take profit. While I want to shoot for the moon and go $58, I'm wondering if I do half and half and reset my stop loss to $54 for the one I keep open. Haven't fully decided yet, but I'll think about pros and cons.
Member discussion